The Weird Portfolio
How To Avoid Bubbles, Limit Drawdowns, and Safely Grow Wealth
Introduction
This book describes an approach to investing that I developed for myself and I thought it might be useful for others.
It may not be for everyone. All investors have different risk tolerances and core beliefs. People are unique. This approach isn’t for everyone.
The portfolio utilizes six low-fee ETF’s to create an investment regime that is designed to deliver a satisfactory rate of return in multiple economic environments.
Like the title says: this portfolio is designed to avoid financial bubbles, limit losses during recessions/depressions, and safely grow wealth over a long period of time.
Each ETF represents an asset class. On their own, all of the asset classes are highly volatile. When lumped together in a portfolio, volatility is reduced and the portfolio still earns high returns. Because the asset classes all deliver returns during different environments, volatility is reduced and the portfolio delivers a consistent result.
I’ll cut to the chase: these assets, when lumped together in a portfolio, deliver a return similar to owning 100% US stocks but with significantly less volatility and more shallow drawdowns. Most importantly: all of these asset classes are available to everyday investors in cheap and tax efficient ETF vehicles. You can jump right to the back-testing data at the end of the book to see these results.
However, the historical results aren’t the whole story. For this portfolio to continue to deliver results in the future, then these asset classes must continue their historical relationships. If these relationships don’t persist, then the portfolio won’t continue to deliver the fantastic results that it has in the past.
That’s why it is important to understand why these asset classes deliver their returns when they do. This book explains why I think that these relationships are likely to persist into the future. That’s what this book is all about, but you’re free to skip ahead and cut to the chase if you would prefer.
I would like to give a special shout out to the author of the Portfolio Charts blog, who was gracious enough to let me use his data for my back-testing. By far, his blog on asset allocation is one of the best resources that you will find.
Who I Am & Why I Wrote This Book
“The only true wisdom is knowing that you know nothing.” — Socrates
I’m not Warren Buffett. I’m not Stanley Druckenmiller. I am not a sage of investing.
I’m just an anonymous financial blogger and a corporate drone who tries my best to figure out what’s happening in the crazy world of finance.
In more practical terms, I’m trying to deploy my savings. My savings isn’t much in the grand scheme of things, but I take growing and protecting my savings very seriously.
I have been fascinated with investing since my teen years during the internet bubble in the late ’90s. I’ve been trying to figure this out for a long time, and I still struggle to do it.
Back in 2016, I started a blog where I tracked the actual performance of one of my brokerage accounts. In this brokerage account, I express my opinions about individual companies and the economic environment. My track record leaves a lot to be desired at the moment.
I often pick the wrong stocks, and I’m often wrong about the future. I put a lot of emotional effort into managing this account. The fruits of my efforts have mostly been the loss of hair.
I am a stubborn guy, so I keep trying and plugging away. I find the game fun, and it challenges me mentally. I enjoy it. Other people might choose a fantasy football team; I try to figure out the economy and which stocks will perform the best.
With that said, my results made me realize that I should develop an approach for most of my money that doesn’t try to predict the future because I get it wrong so often. I also wanted something much less stressful than owning 100% stocks. After all, the stock market has maddening levels of volatility and terrifying drawdowns.
A few years ago, I started to pursue financial independence, inspired by the likes of people like Mr. Money Mustache. I didn’t want to retire, but I wanted to have enough money to be a bit choosier about my time and mental energy.
To do this, I needed an approach to investing that is more reliable than my often-unreliable forecasts about the economy and individual stocks.
I also needed an approach that suited my personality. To put it simply: I am a pretty risk-averse kind of guy. I am not a sunny, cheery optimist who assumes everything will work out.
I often think in terms of worst-case scenarios. WebMD is a dangerous place for me. I know that the worst-case scenario won’t happen all the time, but thoughts of disaster always plague me.
I’m not what they call an “optimist.”
I’m not a doomsday prepper with a fully stocked pantry of emergency food rations and ammunition, but I’m always thinking of what could go wrong.
Risk-averse people like me often choose risk-averse investments. The most risk-averse investment is cash in a bank account, but that is a guaranteed loser over the long run. The interest on a bank account is never going to overcome inflation. Cash will gradually decline as inflation (which advances at roughly 2% a year) chips away at the purchasing power of money.
As for actual physical cash sitting in a safe — forget about it. If it’s earning no interest at all, then it’s guaranteed to lose over the long run.
Cash can be useful to deploy at opportune moments in the stock market, but an investor needs to accurately identify those moments. Warren Buffett has done this throughout his investing career. He accumulates cash when markets are frothy and then deploys it during bear markets. This is something that I attempt to do with my own money, but sadly, I am not 1/10 as good as Warren Buffett.
The only way to build wealth is by making money grow at a rate that exceeds inflation. Cash, therefore, is a guaranteed way to get crushed.
Sometimes people like me — who think in terms of worst-case scenarios all the time — get attracted to things like gold. Gold has been a safe asset for thousands of years of human history.
Gold has a lot of positive attributes (it’s a part of my investment approach), but the most an investor can expect from gold is to meet the rate of inflation over the very long run. With that modest return, gold endures tremendous volatility and terrible drawdowns. Gold lost 60% from 1981 through 1999, for instance.
So, if we want to make money, we have to take risks. There isn’t any way to completely get around that fact. Unfortunately, there is no such thing as return without risk. What risks should I choose? What would be an approach to investing that negates the need for a forecast but can reliably grow wealth over time?
One suggestion would be to buy a US market cap weighted index fund like the S&P 500.
If you can’t beat the market, the thinking goes, then obtain the average performance from the market.
This approach didn’t sit right with me, either. For starters, I know enough about market cap weighted stocks to see that it is expensive right now. When it gets expensive, it usually delivers low returns over the next decade or two.
I also know that the stock market can go through long periods where it does nothing but deliver agony.
There was a period from 1929 to 1954 (25 years), where the Dow Jones Industrial Average was flat. The market was also flat from 1966 to 1982 (16 years). In the 2000s, due to the tech wreck and the real estate bubble collapse, stocks did nothing. Stocks were flat for that decade but put investors through a high level of stress in the form of two nearly 50% drawdowns.
During the history of the US stock market, investors had to endure horrifying amounts of pain. There was an 80% drawdown in the early 1930s — a 50% drawdown in the 1973–74 bear market. There was also a 45% drawdown in the early 2000s, and a 50% drawdown during the 2007–09 financial crisis.
As for less catastrophic declines, they happen constantly. 10–30% declines happen all of the time, often without any reason.
On top of all of that pain, there are long stretches of time where stocks deliver no return. Imagine enduring all of that pain and then going through a 10- or 20-year period where you earn nothing. It has happened before and isn’t outside the realm of possibility for the future. This was the experience of American investors in the 1930s, the 1970s, and the 2000s.
Index funds also don’t sit right with me because I know that the experience of American investors — stocks usually go up and bounce back from declines — is unique.
In the rest of the world, stocks don’t always go up. The Japanese stock market, for instance, still has not returned to the highs of 1989. Imagine waiting 30 years, buying and holding, and not making any return on your savings but still going through massive drawdowns and pain.
For these reasons, I am not interested in buying and holding an index fund of US stocks. I realize this is the typical investment approach of most people who pursue financial independence, but it is not for me.
I also know that I am often wrong and often do a lousy job of predicting the future.
What is someone like me to do in this situation?
Traditional advice from people pursuing financial independence doesn’t resonate with me. I also don’t want to hire a financial advisor, as I don’t want to pay someone fees to do something that I can do myself. I also know that I am not the best at picking stocks and forecasting the economy.
I set out to develop a unique approach that would work for me. I wanted to design an investment strategy that could handle multiple economic environments, avoid lost decades, minimize drawdowns, and would negate the need for an accurate forecast about the future.
This approach would need to meet some critical criteria:
1) It wouldn’t need to predict the future.
2) It would be low cost.
3) It would be easy to implement. I don’t want to have to spend hours every week to adjust and hedge positions.
4) It wouldn’t rely on the genius of a manager whose genius can fade, or whose judgment can be affected by personal trouble.
5) It would have protection for all of the different kinds of economic environments that the world can throw at it — depressions, recessions, strong dollars, weak dollars, inflation, deflation, prosperity, or the disappointing ending to Game of Thrones.
6) I wouldn’t have to lose 45%-80% of my money every 15 years.
7) I wouldn’t have to endure long, lost periods (like 10–25 years) where I didn’t earn any return on my money.
8) I wouldn’t have to pay someone a lot of money to implement it.
9) The value of my money wouldn’t fluctuate a lot and stress me out.
I believe that I’ve developed a plan that meets all of these objectives. It’s how I invest my own money outside of my “speculative” account that I track on my blog where I go after the maddening pursuit of trying to outperform the market.
I thought I would share my approach because I felt that people needed to know that there is a different way to invest outside of mainstream financial advice. There aren’t many books that show an alternative path, so I thought I would write one.
Most books about investing recommend holding stock index funds forever and not worrying about the market.
Do stocks drop 50%? Have faith, and they will always return! For some reason, the authors take 250–500 pages to tell you this. It’s odd to me that the authors think their book was necessary when hundreds of investing books tell you the same thing.
This book takes a different approach. This book is an investment approach that I designed for myself. I think it offers a satisfactory return that meets my goals. I know this approach won’t make me fabulously wealthy, but I think it’s a sound way to invest money, grow wealth, and not have to chug Pepto Bismol when looking at the brokerage statement.
My approach isn’t for everyone, but it works for me. I thought it might resonate with people in a similar situation.
It might not resonate with you, and that’s okay. It’s a weird approach to investing. It uses controversial asset classes, like gold and small cap value. It has no weighting to US large cap market cap weighted index funds, which are foundational to most portfolios. It’s a weird portfolio. (This is my favorite part of the movie — when the title is awkwardly dropped.)
Anyway, even though this portfolio isn’t for everyone, I thought it might help some folks in a similar position to me. It might not be for you, and that’s okay. Everyone has a different personality, different goals, and different approaches to investing. There are many valid approaches to managing money, and there isn’t one true faith. The most crucial part is finding a plan that works for you.
Also, this is intended to be a short read. I’m a big believer that too many books about investing are too long when they are communicating a simple message. I do not understand why someone needs to write a 250-page $40 book that simply says, “Do not try to outperform the market and buy an index fund.”
I wrote this so people could breeze through it in a couple hours on Saturday afternoon. I get to the point and there is no filler. Hopefully, you find it useful and not a waste of your time.
Personal Finance
The focus of this book is on investing, not personal finance. This book outlines an approach to investing that works for me.
Of course, an investment strategy is meaningless unless a person actually has savings to deploy.
The reality is that investing is only a small portion of the battle. Saving money in the first place is the critical step in the process of building wealth. The importance of investing pales in comparison to the importance of personal finance. It took me a long time and some horrible experiences to realize this truth, but it is indeed the truth.
The core issue in personal finance is consistently spending less than you make.
If someone consistently spends more money than they make, they are going to accumulate debt. Debt has the damaging effect of making compound interest work against you. When compound interest is working in your favor, it snowballs over time and builds wealth. When compound interest works against you, it slowly ruins your life.
It’s hard to find an investing strategy that can achieve a 7% rate of return after inflation over the long run. Meanwhile, the average credit card interest rate is 18%. It is virtually impossible to find an investment strategy that will yield 18% over a long period, so someone paying this type of interest regularly is in a terrible situation.
Bill Burr once remarked that the mafia became irrelevant because their businesses became legal. He’s right. 18% is the kind of interest rate that mafia loan sharks used to charge degenerate gamblers in the 1950’s. Now, banks can do it legally thanks to the repeal of usury laws.
The average American has a credit card balance of $6,200. At an average interest rate of 18%, they’re paying $1,116 in interest a year. If that $1,116 could be invested every year into a strategy that yields 7%, in 30 years, that money would accumulate to over $100,000.
It’s also important to look at debt not in raw mathematical terms — but through the lens of the behavior which creates debt.
If a person’s debt is rising, then the person is living beyond their means and saving nothing. If someone makes a habit of living beyond their means, they are guaranteed never to accumulate wealth.
Debt isn’t a mathematical problem; it’s a problem of behavior. Debt can arise through no fault of the person — such as medical debt. In most cases, though, debt is a lifestyle choice and an American addiction.
It’s vital in this case to distinguish between needs and wants. In the United States, we find it hard to differentiate between the two. You need a roof over head and water to survive. You don’t need a new car. A $5,000 used car can get the job done just fine. You don’t need a big house. You need a place to live. You don’t need a premium cable package or the latest iPhone. A used model will do just fine. Get an HD antenna and a cord cutter cable package. You don’t need to eat at a restaurant every week. You can prepare a perfectly adequate meal in your kitchen for a few dollars. You don’t need to take on debt to go to an expensive private college. You can go to a cheaper state school. There are plenty of job opportunities in the trades or from fields that only require a two year degree.
Also missing from the discussion is an approach to happiness in general. When I was young, I used to think that wealth was about luxury and extravagant spending. Many rich people feel the same way, but none of that luxury brings them any happiness. Once a person meets an income that helps them achieve their basic needs, additional income doesn’t bring them any satisfaction.
A good exercise to figure out what’s really important in life is to make a list of all of the things in life that bring you joy. I’m willing to guess that most of these things are free.
What brings you joy in life? I’m willing to guess that they’re probably things like the time you spend with a loved one, a walk on a sunny day, or helping others. Your list is probably not stuff you can buy at a store. Buying the latest gadget or the smell of a new car provides only fleeting pleasure that quickly dissipates.
We like to spend money to get a dopamine rush. It gives a temporary feeling of pleasure. Money also unleashes our competitive impulses, which doesn’t do anything to increase happiness. Does it matter what our neighbor thinks of our car? Does it matter what a stranger thinks of our clothes? Does it really matter if people are impressed with our title at work?
As Americans, we have an unhealthy relationship with money. We see luxury as the end unto itself, and it’s just not true. We chase luxury with reckless abandon at the expense of things that matter and wonder why we’re miserable.
Material abundance is continuously increasing, and we push for it with reckless abandon.
The average home in 1960, for instance, was 1,300 square feet. Today, it is 2,700 square feet. They likely didn’t have a brand new car. They didn’t have iPhones, a big cable TV bill, a vehicle for every adult in the house. They lived a more straightforward, cheaper lifestyle. They were also happier. Talk to your grandparents and you’ll see this to be true. More stuff doesn’t make us any happier in life.
If money can’t buy happiness, then what’s the point of pursuing it?
The point, I think, is that money can buy a person’s freedom.
Here is a life that you can visualize. Imagine that you have no debt and don’t owe anyone on Earth a cent. You own your home outright. It’s not an extravagant home, but it’s all yours. You have an investment portfolio that generates a passive income for you year after year. You can work on your terms. You don’t have to answer to a boss. You have a cheap, paid for, car in the driveway. If your boss asks you to do something unreasonable, you can say no. If something breaks around the house, you have the cash to pay for it and don’t have to go into debt.
You own your time, and you have a lot of it. You can use this for money-making pursuits, but they are money-making pursuits that bring you joy and not a job that trades agony for money. Maybe you like to write books or volunteer. Perhaps you want to create art and sell it online. Whatever it is, you can pursue what makes you happy, and you don’t have to do unpleasant things to earn a living. You don’t have to do things that make you miserable until you drop dead.
That’s financial independence. That’s a goal worth pursuing. That’s not a car, a bigger house, or luxury.
True independence — true freedom — is worth striving for.
I’ll bet that a person in a simple situation of financial independence with modest spending is a lot happier than a high powered investment banker in Manhattan earning millions every year. The investment banker has to work 100 hours of work under constant stress and pressure to maintain their multi-million dollar luxurious lifestyle. They have to keep their kids in the most excellent schools, pay the mortgage on a $10 million penthouse, own a vacation home, buy the most beautiful suits, pay for incredible cars. None of it makes them happy, but they have to work continuously in something that brings them no fulfillment to maintain a lifestyle. They live a life of luxury, but they are not free. If they lose their job or take their foot off the gas, they can lose it all.
The goal, as I see it, isn’t to buy more stuff or increase prestige. The goal is to have enough money and a cheap enough lifestyle that you can do whatever you want. You want to own your time and energy.
Money isn’t about stuff — it’s about freedom.
I came to this truth through personal experience.
I entered my twenties with a very unhealthy relationship with money and life. I thought of money as a tool for pleasure and not as a tool for independence.
My life quickly descended into a hard-partying, hard-drinking lifestyle. I got addicted to alcohol and thought that going out and partying every night was a source of happiness.
It brought me no happiness, and it left me utterly miserable. The worst part is, it led me to accumulate a significant amount of debt.
By the summer of 2008, my life was a complete wreck.
I was out of college for a couple of years. I lost my first job and was a year into my new one. I had no savings and was sitting on a significant amount of debt. I was struggling to get by. I had no savings. My checking account would often go negative as I approached payday.
Lehman Brothers then collapsed, and it looked like the other banks are going to fall with it. The world economy and financial markets blew up spectacularly. Absolute terror gripped the world.
I always followed the markets closely, and at that moment I was aware that we might be facing the second Great Depression.
Meanwhile, I was facing the second Great Depression in financial shambles.
My credit card interest rates got jacked up to 30% as I digested what was happening to the economy. I was already down, and it got worse. Most of my income was being eaten up by interest.
Nearly 40% of my income was going to payments, and most of those payments were interest.
I also had no idea how much longer my job would last. What if my employer went out of business? What if I got laid off?
It was a horrible situation, and I’ll never forget how I felt. I felt desperate, and my life felt like it was out of control.
I thought of myself as someone who knew about money, but the truth was that no matter how much I knew about investing, I didn’t know anything about life. I didn’t understand that buying the coolest gadget or having a fun night out at a luxurious bar wouldn’t bring me any happiness.
At the age of 26, my life was a total and complete mess. I thought back to the person I was at 18. How full of optimism I was about the future. I felt like an actual failure in comparison to those ambitious dreams I made for myself.
I’ll never forget the way that this moment in my life felt. I felt hopeless, and I felt utterly broken as a person. I felt trapped and scared. The future was unknowable. Financially speaking, I was unprepared for what was unfolding. I was only 26 years old, and I already felt like a washed-up failure of a human being.
I vowed to end the situation. I vowed that I would never experience that kind of self-created mess ever again.
To save money, I took extreme measures, like renting out a cheap basement to live in. I did everything and anything to cut costs and minimize my expenses. I tried to spend no more than $50 a week on food, for instance.
I would often contemplate the mess I created for myself and ask myself questions like: “How could I have been so careless?” “Why was I so stupid?”
The truth was that it was the best thing that ever happened to me. It helped me become a more disciplined person. It took discipline that it took to get out of debt, save money, and end my addiction to alcohol.
I quit drinking and ultimately got out of debt. I took extreme measures to lower my expenses and live beneath my means. It ultimately paid off and I got out of the hole.
A key-person who helped me in my journey was the financial commentator Dave Ramsey. I have a different approach to investing than Dave — but that’s just details. Dave’s advice for getting out of debt helped me tremendously.
If you have a lot of debt, if you consistently spend more than you make, then my book about investing won’t be of much help. There is no way to get ahead if you can’t actually save any money.
If you have a lot of debt, you should probably read Dave’s book — The Total Money Makeover — which will give you simple and practical advice to pay off your debt and start to change your life.
I used Dave’s plan — the debt snowball — to get out of debt. He advocated listing debts in terms of amounts, not interest rates, and systemically paying them off, using the larger cash flows to reduce each larger debt. This strategy is mathematically unsound, but Dave’s insight is that debt has nothing to do with math. It’s about behavior and the debt snowball helps your attack debt in a behavioral way. Each victory over each debt balance gave me momentum. By the time I was finished, I felt victorious and I swore never to get into a situation like that again.
Dave also has some great, practical advice to stay on track. He recommends staying out of debt and having a cash emergency fund with roughly six months of expenses. The purpose of this is to keep you from going into debt to pay for an emergency (like a loss of a job or a major home repair). It also keeps you from dipping into your investments.
Many personal finance books focus on things like cutting $5 latte’s or other minor expenses. I like the Ramsey approach better. Go after your debt with a bazooka. Downgrade your house if it’s too much. Downgrade your car. Slash your grocery budget. No half measures. As he puts it, go on “beans and rice” until the job is done.
While Dave gives practical, step-by-step instructions for getting out of debt and establishing a strong personal finance foundation, I think there is a better book for changing your fundamental relationship with money. The book that accomplishes this goal is Your Money or Your Life by Vicki Robin and Joe Dominguez. While Dave’s book gives some excellent practical advice for getting out of debt and establishing a firm financial foundation, Your Money or Your Life provides a more philosophical approach to money.
The book shows the reader that money is not a source of happiness, but a tool to achieve freedom.
The book also contains an essential exercise. It recommends that you figure out how much money you have earned in your adult life and compare it to your net worth. For most people — including myself — this is a sobering and eye-opening experience. You’ll see how much money you’ve worked for in your life and how little you have to show for those efforts.
An excellent way to figure out your life’s earnings is to go to https://www.ssa.gov/myaccount/, which breaks down your income year by year.
The point of this exercise isn’t shaming. The purpose is to make it clear that we all have an unhealthy relationship with money and spending.
When you sit back at think about all the money you have wasted in your life — on overpriced cars, expensive meals at restaurants, gadgets gathering dust, overpriced drinks at bars — it puts into perspective how wasteful our lifestyles are. The point of the exercise isn’t to shame your past, but hopefully, help you develop a healthier relationship with money for your future.
It is only by establishing a healthy relationship with money that a person can move forward and stay out of debt and consistently accumulate wealth.
Once you’ve paid off your debts, are living beneath your means, and have a good emergency fund — then it’s the time to talk about investing. To get to that point, a healthy mental attitude towards money and life is necessary. Without that attitude and without the actions required to achieve that, then your investment strategy doesn’t matter.
Without this foundation, there isn’t much of a point to learning about investing. Without savings — without capital — it doesn’t matter what kind of portfolio you chose.
The significant muscle movement of personal finance is saving. A sustained and high level of saving isn’t possible if you don’t already have a healthy relationship with money. If you see money as a tool for pleasure and consistently live beyond your means, then you’re never going to save anything no matter how high your income is.
Once that foundation is established — consistent saving, consistent living below one’s means, a healthy attitude towards money — then that is the time to talk about investing.
So — how do we invest?
The Unknowable Future
When most people think about investing, they think in terms of “beating” the stock market.
There are two basic ways to attempt to beat the stock market:
1) Pick the asset classes that will perform best. Stocks or bonds? US Stocks or international stocks?
2) Pick the individual stocks that will outperform.
Both of these things are an attempt to predict what will happen in the future.
In the absence of a Flux Capacitor and 1.21 gigawatts of electricity, this is a difficult feat to accomplish.
Warren Buffett has focused on strategy #2. Buffett does this by finding stocks that are cheap relative to their fundamentals. He then tries to make a reasonable prediction about the future. He likes companies that have a “moat” to defend themselves from the competition while simultaneously earning large profit margins.
The most famous example of this is his investment in Coca-Cola. Buffett realized that Coke was an incredible global brand. People will buy Coca-Cola over a cheap store brand cola. Coke’s brand power allows Coca-Cola to charge more in price and earn a higher margin. Meanwhile, he also recognized that Coke could grow over time by expanding internationally.
Ray Dalio has focused on point #1. Dalio is adept at identifying where we are in a business cycle. Before the global financial crisis, he pivoted to asset classes — such as long term government bonds — that would benefit from the financial crisis.
Why not duplicate Buffett’s or Dalio’s methods?
The problem is, few investors succeed in picking stocks or choosing the right asset classes. There are plenty of people who have consumed Warren Buffett’s letters, but few that have been able to replicate his returns. Dalio has written much about his approach, but there are few investors who have been able to pivot to the right asset classes at the right times.
It would be nice if we had Dalio or Buffett’s skills and intelligence, but the sad reality is that very few of us do.
I attempt to do both, and my results are often unsatisfactory, even though I occasionally get something right. I chronicle these efforts at my blog. I find it fun and enjoy discussing my efforts with people on social media, but the reality is that I am no Warren Buffett or Ray Dalio.
Buffett makes picking stocks look easy. Find a moat and a margin of safety and bam, buy.
The problem is that this is extremely hard to do. Even Buffett makes mistakes, and his stock picks can turn against him. There are many examples of Buffett’s mistakes, but one that sticks out is his purchase of Dexter shoes in 1993. Buffett paid $433 million for the shoe company, which slowly became worthless as the company fought off cheaper shoes from low-wage countries.
Dalio gets things wrong, too. Dalio proclaimed that “cash is trash” in January 2020, shortly before the market collapsed due to COVID-19. Throughout the 2010s, Dalio also frequently compared the market environment to 1937, but the 1937-style market crash never arrived.
The future is hard to predict, even for the greatest investors of all time. The difficulty of prediction is a phenomenon studied carefully by Philip Tetlock, who observed that experts often fail to predict the future. Experts fail to predict the future even when equipped with high quality and confidential information. I highly recommend his book, Superforecasting.
If great investors like Warren Buffett and Ray Dalio make mistakes and everyone (including experts) are terrible at predicting the future, then what are the odds that you and I are going to get things right?
The simple conclusion is that the future is almost entirely unknowable.
Therefore, we face a unique challenge. We know that merely stuffing cash in a mattress or savings account is a guaranteed way to burn wealth over time. At the same time, we also know that it is challenging to pick the asset classes and stocks that will perform well.
For this reason, I set out to design a portfolio that keeps prediction to a minimum. My goal was to create a portfolio with different asset classes that would perform well in different economic environments without attempting to predict which economic environments will arrive.
What are some of these economic environments that are possible in the future? Here are some possible scenarios.
Inflation — The US Federal Reserve has been furiously creating money since the financial crisis. So far, this hasn’t increased the inflation rate. This money creation kicked into overdrive with COVID-19. Inflation begins to soar into the double digits in the 2020's, with no end in sight. To combat inflation, the Federal Reserve needs to increase interest rates massively. The increase in interest rates means that stocks should be valued less, and stocks fall. The interest rate hikes also lead to bond prices declining, as bond prices and interest rates are inversely correlated.
Deflation — The US faces a shock that the Federal Reserve can’t handle. Terrorists detonate a nuclear weapon at the heart of New York City. They launch smaller battles throughout the country, aided by sleeper cells. US economic activity plummets, and the country gears up for total war. Directly printing money will do nothing to revive a shell-shocked economy that is terrorized by fear. Deflation sets in, with the price of goods plummeting. The stock market crashes in reaction to these events.
Prosperity — The US enters a period of strong economic growth. Advances in technology, such as robotics and artificial intelligence, dramatically improve the productivity of US workers. Improvements in the efficiency and quality of production causes wealth to explode. The stock market continues to set all-time highs — US employment increases due to the bounty. Meanwhile, the technological improvements and advances in production keep inflation at bay.
Secular Decline — Decades of deficits finally catch up with the United States. The United States finds it difficult to sell bonds, and interest rates increase. The US dollar loses its place as the global reserve currency. The decline in the dollar’s value strengthens international markets at the expense of the United States economy.
The above scenarios represent a handful of situations that I can imagine in our unknowable future. I have no idea if any of them will happen and neither does anyone else.
I wanted to design a portfolio that would be able to handle all of these outcomes. I wanted a portfolio that could survive anything that the world could throw at it.
I wanted an iron portfolio with the resiliency to survive anything, but also one that could grow my wealth over time assuming that the global economy continues to grow over the long run.
I used to think that the way to do this was to choose the right stocks, but I soon realized that stocks are only a single asset class. I also realized the profound difficulty of selecting the right stocks in my attempts to beat the market.
I quickly realized that the way to grow wealth and control for different outcomes was asset allocation, as opposed to stock picking.
A phenomenon I observed, for instance, was that no matter what stocks I chose, once I owned enough of them, my portfolio of stocks would move in lockstep with the US stock market. It didn’t matter if the composition of my portfolio was entirely different from the overall US stock market; it still moved in tandem with the market. If the market crashed, then my portfolio would crash as well. Usually, my portfolio would crash more than the market.
I also realized that there were asset classes would do well if stocks went down. Why not own some of them as insurance?
I set out to create a portfolio of asset classes — as opposed to a portfolio of stocks — that would have elements that would survive the different economic environments in our unknowable future.
So, how do we do this? How do we design a portfolio that will be able to handle a different outcomes in an ultimately unknowable future?
The Trouble With Index Funds
It should be noted that when I refer to ‘index funds’ in this section that I am referring to a very specific kind of index fund: 100% US market cap weighted stocks. The portfolio I outline later in the book uses index funds, but applies them to different asset classes and segments of the stock market.
If the future is unknowable, and it is hard to predict, then what is the best way to invest?
When most people consider buying stocks without making decisions about the economy or stock selection, they turn to index funds. These are funds that charge low fees and own the entire stock market.
Buy an index fund, and you won’t outperform the stock market, but you’ll do average.
Over time, average returns in the stock market are quite spectacular. $10,000 invested in US stocks in 1970 would be worth over $1.1 million by the end of 2019. That is over a 10% rate of return.
Not only do US stocks perform well, but the theory behind an index fund is intuitive and easy to understand.
There are many participants in the stock market, attempting to make bets about which company will perform best. They talk to management; they research companies in depth; they pore over data.
All of these participants are trying to figure out which stocks will perform best in the future. Some investors succeed in doing this, but most do not. Research indicates that the typical active manager underperforms the market. The underperformance of active management is probably best documented in Burton Malkiel’s book, A Random Walk Down Wall Street.
The situation is worse because these active managers charge high fees, while an index fund is virtually free.
The math behind fees is pretty simple. Let’s say an investor opens an investment account with $10,000, earns a 10% annual return, and then contributes $10,000 to the account every year.
At the end of 30 years, this investor should have $1,809,434.25. However, if the same investor pays 1% a year in fees, that amount is reduced to $1,456,975.47. Fees cost this investor $352,458.78. They have only 80% of the money of our hypothetical index fund investor.
It’s also important to remember that most active funds underperform the market. This investor likely paid high fees and simultaneously earned a lower rate of return than the index investor.
The evidence is loud and clear: active management sucks. Active management consistently underperforms the market and charges too much in fees. Even if they could outperform, the fees of most active managers would eat into the high returns. Sure, there are stellar active managers — like Peter Lynch, Ray Dalio, or Warren Buffett — but what are the odds that you found the next Peter Lynch, Ray Dalio, or Warren Buffett?
Due to fees and the inability of active managers to outperform, index funds seem like a pretty good bet for a long term investor. Index funds charge low fees and deliver decent performance. It seems likely that corporate America will continue to grow earnings and sales, and an index fund investor can expect to share in those rewards.
So, why don’t I invest in US market cap weighted index funds?
I don’t invest in index funds for a few reasons.
1) I want to weight my portfolio towards cheap stocks and away from popular stocks.
When you ask an average person how an index fund works, they will likely say that the index is composed of the biggest companies.
How do we measure the biggest companies?
Most people think that the index tilts towards the companies that make more money.
Surprisingly, that is not how index funds work. Index funds are built based on market capitalization. Market capitalization is the number of shares multiplied by the price. In other words, index funds are weighted not based on any fundamentals, but simply based on what investors are willing to pay for the stock.
Market cap weighting leads to an interesting dynamic. Index funds purchase more of the stocks that are going up. As the price of a stock rises, the index systematically buys more of it.
In my view, this is the opposite of what an investor should do. An investor should buy undervalued companies. An undervalued company will likely have recently gone down. I want to weight my holdings towards companies that are a bargain.
The research shows that merely weighting a portfolio towards cheaper companies works very well.
From 1972 through 2018, owning small, cheap stocks (known as “small-cap value”), has delivered a 13.9% rate of return compared to the market’s 10.4% return.
In other words, small-cap value turned a $10,000 investment in 1972 into $5.2 million. The market would have turned the same investment into $1.17 million.
2) I don’t want to experience horrible drawdowns
US stocks delivered a 10% return since the 1970s, which is outstanding. However, during that period, they went through many horrible declines.
In 1973 & 1974, a $100,000 investment turned into $59,600.
From 2000 through 2002, a $100,000 investment turned into $62,930.
From November 2007 through February 2009, a $100,000 investment turned into $49,000.
In the most extreme example, from 1930 through 1932, stocks experienced a 80% decline in value. A $100,000 investment turned into $20,000.
It’s easy to look at a long-term chart of stocks and advocate that people “stay the course” and buy and hold, but it’s an entirely different experience when you are living through these drawdowns.
When a portfolio becomes large enough, these drawdowns are terrifying and painful. It’s one thing to have a $3,000 account and see it chopped in half. It’s a completely different experience when dealing with large sums. A $1,000,000 portfolio in 2007, for instance, turned into $490,000 by the bottom of the market in 2009. It is incredibly painful to live through something like that.
3) I don’t want to experience long periods of losses
US stocks can remain flat for long periods of time. Many people might think of the “long term” as 5 or 10 years. Unfortunately, the long term is longer than most people think.
From 1969 through 1979, in inflation-adjusted terms, the stock market declined by 13%. Would you want to save and invest for 10 years and lose money?
Another example of a lost decade is 1999 through 2009, a decade in which the stock market declined by 27%.
After the crash of 1929, the Dow Jones Industrial Average did not return to its previous high until the 1950's.
Needless to say, the long term isn’t 5 or 10 years. The long term is 30–40 years and stocks can lose money over periods as long as 20 years.
Meanwhile, these lost decades take place in the United States, whose stock market performed better than any other in the world.
For international investors, the experience is much darker.
The best example of this is Japan.
In the 1980s, the Japanese stock index grew six-fold.
During the 1980s, Japan was the envy of the world. It was the world’s best-performing stock market.
There was an excellent narrative to go along with this stock performance. Japanese companies were better and more disciplined, using novel methods of manufacturing, such as just in time inventory. Japan also had the most excellent education system in the world, producing the most intelligent and skilled workers. Japanese companies performed marvelously, and money poured into the Japanese stocks and real estate.
In 1989, Japan’s Imperial Palace was worth more than all of the real estate in California.
On December 29th, 1989, Japan’s Nikkei index peaked at 38,957.
The Japanese stock market has never returned to those highs. 30 years after the fact, the Japanese stock market has still not returned to those lofty heights experienced in 1989. The index currently stands at 20,750, 46% less than what it was at the 1989 peak.
The value today even obscures the depths of the crash in Japanese stocks. In 2003, the index was worth 8,057.61, a 79% decline from the peak in 1989.
Index investors advocate “buy and hold” for the long term. They say that you should hold stocks through thick and thin because it will always rebound. In the United States, that rebound can take a very long time. The worst-case scenario is the 22-year lull after the Depression. Less extreme, but still horrible, instances are lost decades like the 2000s and 1970s. Investors in other countries, such as Japan, have faced much more dire situations.
This knowledge of history is lost on investors who have been investing in the United States since the early 1980s. Investors since the early 1980s have been taught a simple lesson: buy every dip and stocks usually go up. Looking further back in history, this is not always the case.
In the worst-case scenario, an investor can experience a Japan-like experience, in which an entire investing lifetime can be lost.
I don’t want to experience horrifying 50% drawdowns. I don’t want to experience lost decades, and I want to pivot a portfolio towards sections of the market that are more likely to be undervalued.
For these reasons, I don’t invest in index funds. I have a different approach.
Asset Allocation
How do we prevent drawdowns? How do we avoid lost decades? More importantly, how can this be done in a way that will grow wealth over a long period and do so in a way that minimizes fees and taxes?
The answer, I believe, is in asset allocation.
The US stock market is only one ingredient in the vast menu of components available for an investor.
The world is full of different kinds of asset classes. The beauty of these various asset classes is that they all do well at different times.
There are asset classes that do well when US stocks suffer, like US treasury bonds. There are also asset classes that should perform well when US treasury bonds are doing poorly, like gold.
A portfolio of different asset classes can smooth out the returns and volatility of a portfolio, while still delivering a satisfactory performance over the long run.
We can build a portfolio that won’t go through the horrible drawdowns of a 100% US stock portfolio. We can also build a portfolio that can deliver a more consistent return than a single asset class, with no lost decades.
To do this, we need to look at some of the ingredients that are available for investors.
What are some of these ingredients?
Here are a few of the asset classes available on the menu:
Short term US treasury bills — This is debt issued by the federal government for short time frames. They provide a low rate of return, but the stability of principal.
Long term US treasury bonds — Long term treasuries are bonds issued by the federal government over long periods, such as 30 years. These bonds fluctuate more in price than short duration bonds because the interest rates can be volatile, but they are still backed by the full faith and credit of the United States government.
Investment-grade corporate debt — Investment-grade corporate debt is debt issued by large, stable corporations with a high likelihood of behind paid back. They should offer a higher yield than US treasuries, but with slightly more risk.
Junk-rated corporate debt — Junk-rated debt is also known as “high yield” debt. Junk is riskier debt issued by corporations that is on the more dangerous end of the spectrum. It typically offers a higher yield than investment grade but is more likely to default.
Foreign sovereign bonds — These are bonds issued by non-US governments. The bonds could be for developed countries, such as Japan or Great Britain, or they might be for riskier emerging markets (like India and China).
International developed stocks — These are stocks in developed countries like Japan or Europe.
Emerging markets stocks — These are stocks in countries earlier along in their development. They are growing faster than the developed world, but are also riskier because their economies can suffer more significant shocks.
Real estate — Real estate operates in a class of its own and delivers a return through rising property values and income paid on real estate investments.
Gold — Gold is an asset class of its own. It is the oldest asset class in the world. Countries and empires have risen and fallen throughout human history, but gold retains value. As an asset class, it is a controversial one, but it is the oldest store of value in human history.
Cash — Cold, hard, cash. You can either keep it in your wallet, in a bank account or a safe. It is guaranteed to lose money over the long run due to inflation. Still, it’s not going to experience significant drawdowns, and you can be reasonably sure that you will be able to use it for whatever you want. PJ O’Rouke said that “No government proposal more complicated than ‘this note is legal tender for all debts, public and private’ ever works.”
The above asset classes are only a small snippet of the asset classes available to the average investor. The beauty of all of them is that, like a US stock index fund, they can be accessed cheaply by anyone for a small fee. Anyone could open a brokerage account and buy all of these asset classes cheaply.
There are other asset classes that institutions and wealthy people have access to, like hedge funds, private equity, and venture capital, which aren’t available to ordinary people like you and me.
But that’s okay. Fancy asset classes don’t often do much better than basic asset classes available to everyday investors.
Warren Buffett famously made a bet with Ted Seides in 2007 that a cheap US index fund would outperform a basket of hedge funds.
Hedge funds have access to all of the fanciest strategies imaginable, but index funds still won the day. A big part of the reason is that rich people compete with each other chasing these strategies. A more significant reason is that these fancy strategies often come with an equally lavish fee, which digs into returns.
Hedge funds, for instance, often charge “two and twenty,” which means that they charge 2% of the total assets invested and take 20% of the profits. As most hedge funds underperform the market, this makes it a particularly painful way to invest.
Most rich people don’t want to invest in cheap asset classes for the masses, so they love these expensive and complicated choices. They like them because they’re exclusive. A rich person is accustomed to paying up for exclusivity — which often means higher quality in most arenas of life.
Financial professionals like complex vehicles, too, because a complicated investment scheme sells well. No wealthy person is going to pay someone to say: “Buy a diversified portfolio of cheap asset classes.”
What would be the point of that when it’s easy to do that on your own?
A rich person doesn’t want to drive a Honda. They want to drive a Ferrari.
Unfortunately for them and happily for us, investing isn’t a game where a higher price means better results.
I think we can do perfectly fine without messing around with the Ferrari’s of the investment world.
One of the most classic diversified portfolios available to average investors is the 60/40 portfolio: 60 % US stocks, 40% US bonds.
The performance of this straightforward portfolio — available to everyone at a low price — is outstanding.
Let’s take a look at a portfolio of 60% index funds and 40% in the 10-year Treasury bond.
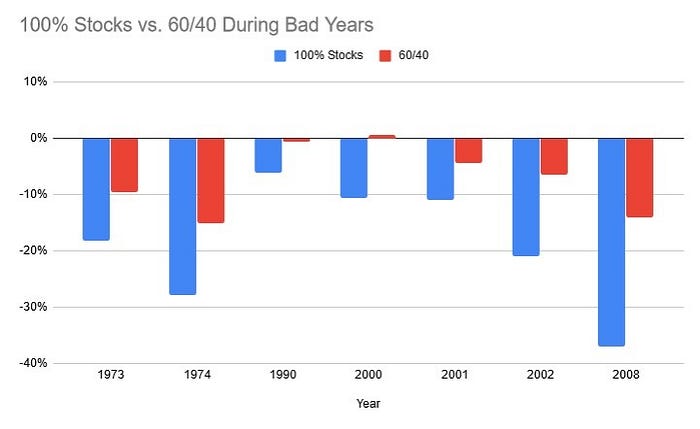
From 1972 to 2019, this portfolio delivered a 9.6% rate of return, turning $10,000 into $815,000. That’s not as good as investing in the stock market alone, but this portfolio avoided the horrors like lost decades and 50% drawdowns.
In 2008, for instance, US stocks declined by 37%. This 60/40 portfolio lost only 14%. During the lost decade for US stocks of the 2000s, this portfolio delivered a 3.5% rate of return while US stocks were flat. It’s not a lot, but it’s a return that turned $10,000 into $14,115. It accomplished this result without the pain of two horrible drawdowns for US stocks: 45% from 2000–2003 and 50% from 2007–2009.
The portfolio does a great job of controlling horrible drawdowns.
Something particularly interesting about this portfolio is that it performs better than the sum of its parts.
Common sense tells us that we can expect the performance of the portfolio to mostly equal its weightings in the portfolio.
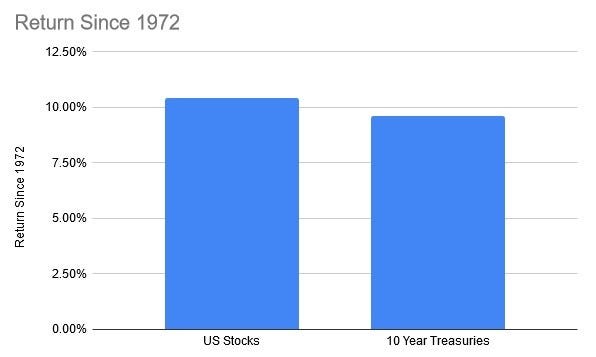
US stocks returned 10.44% from 1972 through 2019. 10-year treasury bonds returned 7.09%.
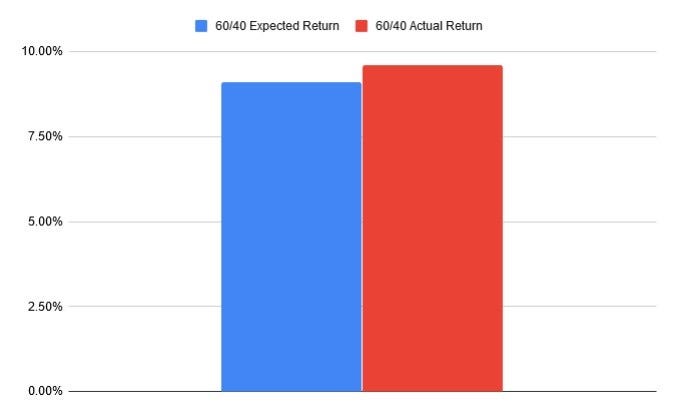
60% of 10.44% (the return on the stock market) is 6.26% and 40% of 7.09% is 2.84%. Add it up, and you get the expected return of the portfolio: 9.1%.
In the real world, something happens that is unexpected and very counter-intuitive. When rebalanced annually (an investor lets the portfolio run every year, then returns the portfolio to the 60/40 weighting at the end of the year), the actual return of the portfolio is higher than 9.1%. The real return of this portfolio is 9.6%. It’s not much of a difference, but it is still astounding: the portfolio adds up to a result that is greater than the sum of its parts.
Why does this happen? Why does this portfolio create a result greater than the sum of the parts?
I think it happens because of the way that treasury bonds and stocks interact with each other. Treasury bonds do well when stocks do well.
When the portfolio is re-weighted, the investor is selling what went up and buying more of what went down. To meet the target of 60/40, they must regularly buy and sell the stocks and bonds to keep it in balance. The investor systematically buys low and sells high.
After a year like 2008, this investor would sell their treasury bonds and use the profits to buy more stocks. They are buying stocks when they are attractive. After a year like 1999, when stocks did incredibly, the investor is selling stocks when they are expensive and buying bonds.
Indeed, 60/40 is a terrific portfolio and an excellent introduction to the concept of asset allocation. It is also an approach that can be purchased cheaply via a mutual fund or ETF, so the investor doesn’t have to think about it.
With that said, I think we can do even better.
There are segments of the US market that have the potential of outperforming, like small value stocks. There are also asset classes that can do well when US treasury bonds under-perform. There are also segments of the US treasury bond market that perform best when US stocks do poorly.
Treasury bonds are also not guaranteed to be a “safe” investment class. When interest rates rise, for instance, the value of treasury bonds goes down. The principal of a treasury bond is also reduced in purchasing power if we experience inflation.
As I write this in May of 2020, the 10-year treasury only yields .63%. The low yield means that while the price will fluctuate over the next ten years, the investor will only earn a .63% rate of return.
US stocks are also costly at this moment and likely to deliver a low return over the next decade.
How do we know that stocks are expensive?
One method is the Shiller PE. The Shiller PE is a popular method of valuing the stock market based on the research of Robert Shiller, a Nobel Prize winning economist and historian. The Shiller PE takes the market’s total price and divides it by the average earnings over the previous ten years.
That PE currently stands at 29. For historical comparison, this is similar to the level in 1929 and at the end of the 1960s boom. In the late 1990’s bubble, the PE went up to an extraordinary level of 45.
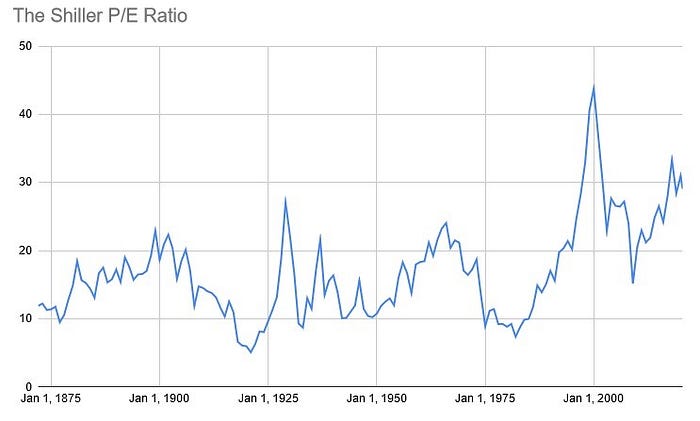
What followed the bull markets of the 1920s, 1960s, and 1990s? Lost decades. Decades where stocks delivered no returns and a lot of misery.
I think it is likely we are about to experience another one of these lost decades in the 2020's.
By another metric — stock market capitalization to GDP — the stock market became the most expensive in history in January of 2020. This metric takes the total value of the stock market and divides it by the total economic output of the United States. In January of 2020, it was beyond the levels last experienced during the internet bubble.
Stock markets experience bull markets and lost decades because investors are continually shifting between periods of euphoria and despair, fear, and greed. Unfortunately, while the stock market grows over time, it doesn’t do so in a consistent way. There are always going to be long periods where it delivers nothing but pain, like the 2000s. There are going to be fast and furious bull markets, like the 1990s, when stocks advanced by nearly 400%.
My goal in creating a portfolio was to build something that would perform more consistently than US stocks and not experience such extremes in fear and greed.
I also wanted to create a portfolio that mostly avoided the issue facing US stocks and bonds: high valuations (stocks) and low yields (bonds).
Additionally, I wanted to access this portfolio in a tax-efficient manner, using vehicles that charge low fees.
The asset classes that met these goals for me were:
1) US small-capitalization value stocks. An asset class that invests in small, cheap stocks. This is sensitive to the broader economy and draws down significantly with the rest of the market during recessions and depressions, but it delivers a high rate of return over the long run. With that said, it doesn’t participates in a manias, such as the late 1990’s bubble. This is a high return (this is “offense”), but volatile, segment of the portfolio.
2) Small-capitalization international stocks. Small, international stocks. This is extremely sensitive to the global economy and experiences significant drawdowns. However, it offers a higher return than most international stocks (this is “offense”). It doesn’t participate in international stock manias, such as the Japanese bubble.
3) US real estate. US real estate via vehicles known as REITs offers a higher return than US stocks (this is “offense”). It does this because it consistently produces dividends and the value of real estate will increase over time with inflation. While it isn’t immune to bubbles, it enters bubbles less frequently than the overall stock market.
4) Foreign real estate. My goal with the “offense” elements of my portfolio was to not only invest in US assets, but to split equally between the US and the world for diversification benefits. For that reason, I split my real estate investments globally.
5) Long term treasury bonds. Treasury bonds tend to increase during periods of economic difficulty, making them the perfect “defensive” asset. Long term treasuries are the most volatile slice of the treasury market. They have the most extreme reaction to recessions. They tend to draw down more than other segments of the bond market when interest rates are going up. However, they also go up more than any other segment of the treasury market when interest rates are coming down, which is usually the case during recessions and depressions. For this reason, they are an excellent “defensive” element to a portfolio.
6) Gold. Gold tends to decline less than stocks during bear markets, while often remaining stable or even increasing. This makes it a good defensive asset during a stock drawdown, even though it isn’t as effective as long-term treasuries. Gold also tends to do well during lost decades for US stocks. Meanwhile, gold also helps balance out the risk of owning long term treasuries. Gold should do well during periods of time when long term treasuries suffer, such as inflation. Over the long run, gold tends to only deliver the rate of inflation, but it helps cushion drawdowns and perform well during periods when both stocks and long-term treasuries are weak.
These asset classes are all highly volatile on their own. When mixed a portfolio, volatility is reduced. Drawdowns are reduced. Lost decades are avoided. While there is no guarantee that these relationships will persist into the future, I think it makes logical sense that they should persist into the future.
In fact, when mixed together in a portfolio, the portfolio delivers an astonishing result. It delivers only a slightly lower return to owning 100% market cap weighted US stocks. Since 1975, this portfolio delivered real (after-inflation) results of 7.4%, while US stocks delivered 8.4%. This is astonishing because 40% of the portfolio is placed in defensive asset classes. It achieves these results with bond-like levels of a volatility, reduced drawdowns, and no lost decades. The worst year for the portfolio was a loss of 18%, compared to 37% for US stocks. Standard deviation for the portfolio was 11.5% vs. 16.6% for US stocks.
This happens because of the way that these asset classes interact with each other, helping create a more consistent rate of return.
To understand why they should persist into the future, we need to look into the nature of each asset class. We need to understand why they all deliver their returns. We need to understand when they deliver their returns. Once we understand that, we can better understand how they should interact with each other in a portfolio.
Small Cap Value
Why do market-cap-weighted indexes go through cycles of extreme bull markets and flat bear markets?
I think a significant reason is because of the way that market capitalization weighted portfolios are constructed.
Because indexes are buying more of the most popular stocks as they go up, the index is doubling down on the most expensive stocks. Meanwhile, indexes are systematically selling stocks that are going down.
Warren Buffett likes to say that investors should be “greedy when others are fearful and fearful when others are greedy.”
An index systematically does the opposite of this. It is selling the stocks that people are fearful of and buying the stocks that people like.
The best investors in history are known as value investors. They are attempting to purchase stocks for less than those stocks are worth. Value investors conduct in-depth research and try to ascertain whether or not those stocks sell for an attractive price relative to what that business is worth.
For those of us who don’t want to do in-depth research and spend all of our time researching stocks, is there an alternative to in depth and research-intensive value investing? Is there a way to systematically recreate the returns of the best investors of all time?
In the early 1990s, economists Kenneth French and Eugene Fama attempted to identify factors that lead to the out-performance of stocks. The determined “value” was a critical factor in returns.
“Value” was defined as stocks that trade at a low multiple versus the value of their assets and/or earnings.
French and Fama were attempting to replicate quantitatively what the best investors of the past did through analysis and research.
Their findings showed that purchasing large groups of cheap stocks, ranked by simple metrics of value, outperforms the market. They also discovered that “value” works best among smaller capitalization stocks. This makes sense intuitively. There should be more cheaper stocks in the smaller segments of the market.
This asset class is called “small-capitalization value,” and it has a historical track record of outperforming the market as a whole. Since Fama and French published the paper in 1993, small-capitalization value stocks have continued to outperform, delivering an 11% return against a 10% return for US stocks.
I think this difference is understated, as that period includes the bubbles of the 1990s and 2010s.
My opinion on the 2010s is controversial, but I believe it was a large cap growth bubble much like the 1990s.
If we take the data back further to 1972, the difference between small cap value and US stocks is more extreme.
Small-cap value has delivered 14% from 1972 through 2019, compared to 10% for US stocks.
In other words, small-cap value turned $10,000 into $5.2 million, compared to $1.17 million for the US stock market.
Other quantitative investors have similar conclusions. One example is the book What Works on Wall Street by Jim O’Shaughnessy. O’Shaughnessy confirmed that all methods of statistical cheapness — price/sales, price/earnings, price/book, or sophisticated ratios like Enterprise Value/EBITDA — outperform buying a market-cap-weighted index of US stocks.
Why does this strategy work? How can a simple price ratio deliver out-performance? What causes this value anomaly, and will it work in the future like it did in the past?
The value anomaly is one of the most hotly debated questions in finance right now. It has turned into an existential problem for some.
Eugene Fama and Kenneth French argue that the out-performance of small-cap value is compensation for risk. Smaller companies are in a more vulnerable position than larger companies. Stocks that trade for cheap multiples are likely cheap for a reason. There is something wrong with the company that makes the market concerned. This means that the stocks may be riskier.
In markets, risk should be rewarded. The thinking is that smaller companies are more vulnerable and cheap companies are going through problems. By this logic, small cap value delivers a return because it is risky.
I think that risk is a part of the equation, but I also think that something else is at work.
When a stock encounters problems, the market tends to throw the baby out with the bathwater. Investors overreact. When a stock is doing well, the market will also reward it with an equally absurd multiple.
In some cases, of course, the stocks deserve these low multiples. Whenever I pull up a stock screener of stocks with cheap multiples, it is usually an ugly sight. You’re buying healthcare stocks in 2010 when the US is discussing healthcare reform that is endangering their profits. Right now, in 2020, these screens are filled with companies in the oil & gas sector, shortly after oil went negative during the COVID-19 crisis.
The market is sometimes right about these stocks. Often, these businesses are in significant trouble and will suffer a permanent impairment.
However, this isn’t always the case. Often, investors have overreacted and the cheap multiple is not deserved. When conditions return to normal for these companies, the multiples increase and the stock price goes up. A value investor purchases these stocks when the market is pessimistic about them and then sells when conditions have returned to normal and the stock price has increased.
Investors like Warren Buffett or Seth Klarman do this through intensive research and thought about the business itself. What Buffett and Klarman do is known as discretionary value investing.
Systematic value investing is different. An investor is simply trying to own enough of these companies to deliver a satisfactory result without trying to pick and choose which ones will do best.
The idea behind a portfolio of cheap stocks is simple. For some of the companies, the market will be right in assigning at a low price. However, for a majority of them, the market will have overreacted. By buying a basket of these stocks, an investor is taking advantage of market mispricings. The bad ones (also known as “value traps”) will go down. Meanwhile, many of the stocks in the portfolio will go up when their situation improves. In a portfolio, the net result is a gain for the investor.
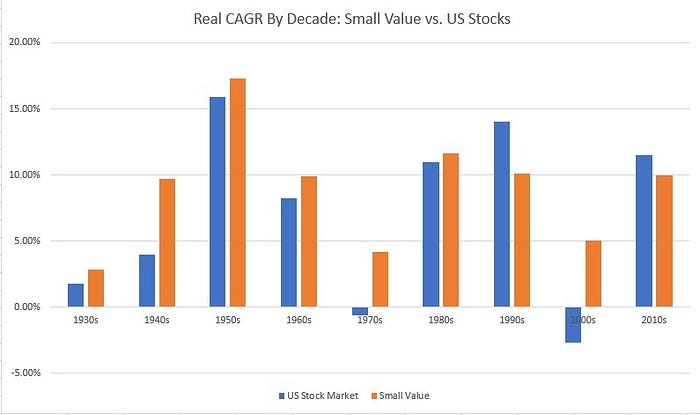
Small-cap value tends to under-perform in fast and furious bull markets like the 1990s and 2010s. It tends to shine in flat markets like the 1970s and 2000s, when the overall market is working off a past period of excess.
While small value delivers a lower return than the market during bull run, the results are still pretty good. The performance is only poor compared to the overall stock market, which is usually experiencing a bout of euphoria that won’t last forever. Meanwhile, small value delivers a lower but perfectly adequate rate of return.
Small-cap value stocks have never experienced a lost decade in US history. I think this is due to the way that the asset class delivers its return. In flat markets and bear markets, there are always going to be out of favor stocks that will later be re-rated to a higher multiple. This is happening all of the time; no matter what the broader stock market is doing, decade after decade. For this reason, small value tends to deliver a more consistent return than US stocks. It doesn’t participate in bubbles, creating a greater consistency to returns.
My opinion about small-cap value is a controversial one. It is certainly possible that the “anomaly” won’t persist into the future.
Many are currently doubting the small-cap-value premium after the bull run of the 2010s in large cap growth stocks.
Of course, in the late 1990s, investors said the same thing. What happened after the 1990s?
While the indexes were negative in the 2000s, turning $10,000 into $9,700, small value delivered a 7.7% rate of return. This turned $10,000 into $20,977.
While the indexes needed to come down to Earth after the late 1990’s bubble, value stocks continued to do their own thing, delivering a distinctive return from the market.
An investor in a small-cap value strategy will lag the stock market during bull markets but should experience a more consistent return than market-cap-weighted US stocks over the decades.
With that said, small-cap value doesn’t offer any protection when the economy enters a severe recession and stocks endure a severe drawdown.
In 1973–74, for instance, small-cap value experienced a 40% decline. During the financial crisis of 2007–2009, small-cap value experienced a severe 56% decline.
Thus, I don’t want to rely on small-cap value alone as my sole source of returns. I think it deserves a significant place at the asset allocation table. I am willing to rely on historical data and make it the core of my portfolio’s strategy. I am even willing to take the unusual step and own small-cap value alone, without holding market-cap-weighted indexes at all.
However, while small-cap-value is the best form of offense in a portfolio, a portfolio needs a defensive strategy to protect the portfolio during severe drawdowns. I will explain the logic behind my defensive allocations in later chapters. My preferred defensive assets are long term treasuries and gold.
Additionally, I do not want to rely on small cap value as my sole source of “offense” in a portfolio. I believe that global diversification is necessary.
I also make real estate a core “offense” component of my portfolio.
International Investing
We live in a world that would be unimaginable to previous generations. You can hop on a plane and go anywhere on the planet quickly. You can take your phone out of your pocket and interact with people all over the world. You can quickly flip on a translator and translate emails and communications with people all over the world. Money can move around the globe at the click of a button.
The integration of the planet in the last fifty years has been truly unimaginable. The growth in global trade and communication has been a tremendous boon for humanity, with extreme poverty levels falling to all-time lows.
Thanks to all of this integration, international financial markets have also opened up to investors in the United States. Forty years ago, it was tough to invest overseas, and most US investors had to invest locally. American investors can now easily invest all over the world at the click of a button. It is a big blue world, and we don’t have to invest solely in the United States.
Unfortunately, the performance of international markets leaves much to be desired. Most US investors would have been better off avoiding the rest of the world. The track record of international investing isn’t particularly encouraging.
From 1990 through 2019, international stocks delivered a 4.6% rate of return, turning $10,000 into to $39,000. US stocks delivered a 9.9% return for the same time period, turning $10,000 into $171,600.
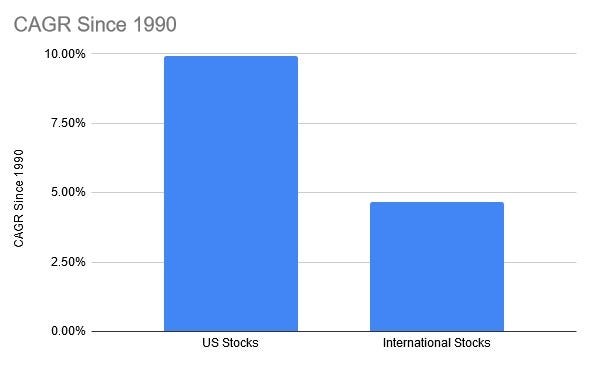
Of course, much of this atrocious performance has to do with the aftermath of the Japanese bubble. The Japanese stock market comprised a bulk of global stocks in 1990, and the deflation of that bubble adversely affected the performance of international stocks. In 1989, Japan was the largest stock market in the world. Japan’s stock index collapsed over the next decade and has still not fully recovered.
While international stocks as a whole delivered poor performance since 1990, there are segments of the international market that performed well.
Emerging markets are one example. Emerging markets provided a much higher rate of return since 1990, clocking in at 8.5%. This performance is not as good as the United States, but it is still much better than the overall international market.
The divergence between emerging markets and international investing as a whole shows how much of a drag the Japanese bubble was on returns when other segments of the global stock market did much better.
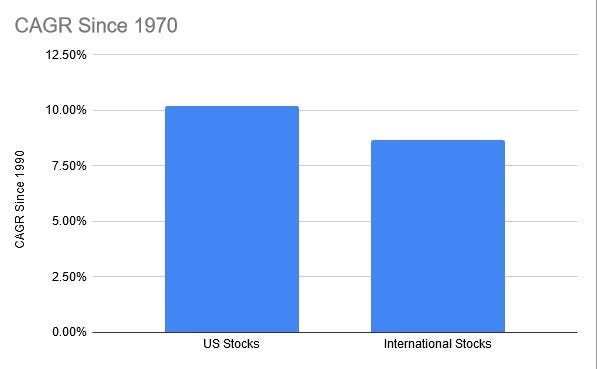
International stocks have a much better track record when viewed over a more extended period. Since 1970, foreign stocks delivered an 8.65% rate of return, which is much more respectable and closer to the return of US stocks.
It appears that returns were front-loaded in the 1970s and 1980s due to the Japanese bubble. In fact, from 1970 to 1990, international stocks outperformed the United States, delivering a 12.73% rate of return compared to 10.6% in the US.
An investor looking at the recent track record of international investing might want to give up entirely on the asset class, but a broader perspective reveals that international investing is better than it looks on the surface. While market cap weighting the world will likely lead to poor performance, there are segments of the international market that can deliver a satisfactory return.
I think it is vital to own foreign assets. International investments offer essential diversification benefits.
A key benefit of owning international stocks is currency diversification. Owning stocks in foreign currency is a nice counterbalance against owning stocks priced in dollars. If the dollar weakens, stocks priced in foreign currencies should strengthen.
An investor shouldn’t be overweight in a single currency. While the US dollar has remained a stronghold for most of the last century, this might not always be the case. Investors in other countries have experienced this first hand, such as Zimbabwe. Zimbabwe experienced rapid hyperinflation and eventually had to disband its currency entirely.
Another example of currency debasement is Germany in the 1920’s.
A loaf of bread in Germany cost 160 marks in 1922 and increased to 200 billion marks in 1923. The hyperinflation in Germany caused massive political instability and misery. It was this environment which allowed Adolf Hitler to take power, who plunged the world into a devastating war and unleashed unprecedented evil on humanity.
The currency collapse in Zimbabwe and 1920’s Germany are extreme examples that likely won’t happen in the United States, even though it is a remote possibility.
Even if such a currency collapse does not happen, there are still other reasons to diversify currency exposure due to the cyclical nature of the US dollar.
The US dollar goes through cycles of strength and weakness. When it is going through periods of weakness (such as the 1970’s and 2000’s), US markets tend to deliver poor relative returns. When the dollar is going through periods of strength (like the 1990’s and 2010’s), US markets tend to perform well. Owning stocks in different markets can diversify these cycles and reduce exposure to a single currency, reducing the risk of a portfolio.
Another critical element of international investing is political diversification. Throughout the 20th century, the US was the best place to invest. The US has sound regulations and a free market. Contracts are strictly enforced, and property rights maintained. We have the world’s reserve currency. The US navy defends sea routes and trade arrangements without the world. As the largest economy with the world’s largest military, it is the dominant power and the dominant economy.
While the US has been the most attractive environment for capital, will that always be the case in the future? Could our political environment fall apart? It’s hard to imagine how US supremacy could fall apart, but it can happen, and a balanced portfolio ought to be prepared for this possible outcome.
The possibility of the US falling apart politically is not zero. Political risk is real. International investing helps diversify this political risk. Even if the US falls apart politically, there should still be other countries that will stay strong. I think it makes sense to spread political risk across the globe. Some countries will win, some will lose. If an investor exposed to all of them, it diversifies the bets and guards against a permanent loss of capital, which investors in countries like Russia and China experienced when they fell to Communism.
I would love to invest solely in US stocks and US assets, due to the track record and affection that I have for the country. Unfortunately, I don’t think that my biases are an optimal way to invest. I want a portfolio prepared for all possible outcomes, even the ones that I don’t wish to happen.
I also think it makes sense to diversify from a valuation perspective. All countries throughout the world won’t enter bubbles at the same time. For instance, the Japanese bubble remained localized to Japan, while the rest of the world was reasonably valued. A globally diversified investor limited their exposure to Japan. While Japan rose to a price/earnings ratio of 100 in 1989 (indicating extreme overvaluation) — the United States was reasonably valued at a ratio of 15.
Right now, the US stock market is the most expensive in the world (with a P/E of 30), although not anywhere as expensive as Japan in 1989. Meanwhile, most of the stock markets around the world are reasonably priced or cheap.
Owning international investments makes tremendous sense from a risk management perspective.
However, just like I pivot my domestic portfolio away from market-cap weighting, I want to do the same thing with my international investments and make a pivot to small-cap value.
Unfortunately, I was unable to find a low expense ratio vehicle to own international small-cap value, so I settled for international small-caps without the value tilt.
Since 1975, this asset class (small cap international stocks) has beaten international stocks as a whole, delivering a 9.9% rate of return than 9.4% for foreign investments.
From 2000 to 2019, international small-caps performed very well, delivering a 6.3% rate of return compared to 3.7% for global stocks.
The asset class has the added advantage of avoiding large-cap bubbles that arise from time to time, such as the United States in the 2000s or Japan in the 1980s. It is my choice for international stock investment.
Real Estate
Real estate is a unique sector of the market, and my asset allocation has a specific focus on real estate.
Real estate can be purchased directly, but an easier way to do it is via financial markets and purchase REITs (real estate investment trusts).
In the United States, REITs are entities set up to invest in real estate and generate cash flow (derived from income on properties) to investors. To enjoy certain tax benefits, REITs must pay out 90% of their taxable income to shareholders. This tax rule means REITs aren’t simply a way to obtain real estate exposure; they are also an effective way to make a portfolio generate income thanks to their high dividend yields.
Since 1972, REITs have outperformed market cap weighted US stocks. They have delivered a 11.6% rate of return in comparison to 10.6% for US stocks.
I prefer to invest in real estate via the stock market rather than buying properties on my own. When I buy REITs in the public markets, I get the benefits of owning real estate but I don’t have to do any of the work of maintaining a property or dealing with tenants and yet I can still enjoy the benefits of income and property appreciation.
A diverse basket of REITs can be purchased easily in a brokerage account through an ETF or mutual fund at the click of a button.
This is a much easier process than buying a property. No home inspection, no mortgage application, no haggling with the seller, no fees paid to a real estate broker. Most importantly: no tenants.
There is also the benefit of liquidity. I can access the cash in my REIT investments at the click of a button. Try doing that with an actual house or building, which can take months or years to unload.
Additionally, it’s possible to diversify REIT investments across geographies. Owning all of the real estate in a single town or region of the country carries a lot of geographic risk.
Real estate in one area can decline significantly, and geographic concentration is a risk. What if all you owned was Manhattan real estate, and then Manhattan was hit with a nuclear weapon? What if all of your property was in San Francisco in 1906, shortly before an earthquake destroyed the city? What if your real estate was in a coastal area of New Orleans before Hurricane Katrina in 2005 and was flooded and destroyed?
Global warming is a rising concern. What if all of your real estate is in a place like Miami? Miami is a place that might be underwater by the end of the century.
In a less extreme example, what if you all of your real estate is in one state in the country, and then that state dramatically raises taxes significantly, causing a mass exodus of the population? What if all of your property is in one town dependent on a single major employer, and then that employer folds or moves overseas? You suddenly have an entire town of unemployed people who can’t pay their mortgages, which will undoubtedly bring down the value of the property and reduce the ability of those properties to generate income.
It’s vital to diversify against geographic risk, which is easier to do in the open markets with REITs than by owning specific properties directly.
Moving away from REITs as an investment vehicle, real estate itself is an attractive sector and deserves and a seat at the asset allocation table for several reasons.
The first key advantage of real estate is inflation protection.
A key feature of real estate is the replacement cost. Replacement cost is a measure of much would it cost to recreate the structure. If the economy is undergoing inflation, then the raw materials and wages to bulldoze and rebuild will increase proportionally to the inflation rate.
Additionally, real estate produces income in the form of rent. Rents increase with inflation. Whether it is rent on an apartment, storage locker, or a data tower, it does not matter. All of these payments are going to increase proportionally to the inflation rate.
The inflation protection is a critical reason that real estate performed well in the 1970s while US stocks performed poorly.
Some will say that stocks alone protect against an inflationary environment. This argument makes intuitive sense. After all, the earnings of companies should increase with the inflation rate.
Unfortunately, stocks suffer in an inflationary environment. Earnings increase with inflation, but interest rates rise in an inflationary environment, which is bad for stocks. Stocks don’t protect from inflation because higher interest rates usually accompany an inflationary environment.
Why do higher interest rates hurt stocks?
When interest rates are increasing, the earnings multiples that investors are willing to pay for stocks will decrease.
This increase in earnings yield is what occurred in the 1970s. The Shiller price/earnings ratio for the stock market declined from 21 in 1969 to a Shiller P/E of 9 by 1980. If you express the P/E ratio a little differently — take one and divide it by the P/E — you get an earnings yield, which is more helpful to compare to interest rates on government bonds. The earnings yield on the stock market increased from 4.76% in 1969 to 11.1% in 1980. As investors migrated to high yields offered on treasury bonds, investors pushed down the prices of stocks, which increased their yield.
Treasury bonds are known as “risk free” investments. If I can buy a 10-year treasury bond that pays a guaranteed interest rate of 10%, then why would I bother buying a stock market that only has an earnings yield (earnings/price) of 3%? This happens throughout the entire stock market in an environment like the 1970’s, when interest rates on government bonds are increasing.
I think that the stock market today is uniquely unprepared for inflation. In the 1970s, higher interest rates caused stocks to go down. However, in the 1970s, more companies had hard assets that also increased with the inflation rate. Today, more companies have intangible assets. The lack of hard assets in our economy means that they are in an even worse position if inflation ever returns.
Real estate, in contrast, is uniquely positioned to benefit from inflation.
Another reason that I like real estate is because it doesn’t participate in bubbles as often as the stock market.
Real estate is less sensitive to the bubbles that usually plague the rest of the stock market. Of course, real estate is by no means immune to bubbles, as we saw in Japan in the 1980s or the United States in the red-bull-and-vodka soaked bubble of the mid-2000s.
While real estate occasionally enters bubbles, it doesn’t do so as frequently as stocks. It is less likely to participate in stock manias. The real estate mania in the United States in the mid-2000’s was the first time we experienced a residential real estate mania in nearly a century. Stocks, in contrast, enter a mania at least once every 20 years.
Real estate participates less in stock bubbles because there is far less speculation around the potential growth in real estate earnings.
For a growth stock, there is a wide range of outcomes. The growth company can take over the world, or they can burn out and go to zero. A growth stock can be the next Google.
The wide range of potential consequences is why investors are willing to pay wildly changing multiples for stocks. The speculation around them constantly gyrates between euphoria and fear.
The rapid changes in sentiment lead to a feeling of euphoria and despair around the prospects of companies. Sentiment shift caused the US stock market to go from a euphoric P/E of 45 in 1999 to 13 in 2009.
With real estate, there is less speculation on how much income the property will generate. The value of a real estate company boils down to real estate values and how much income the properties will generate. This is far less exciting than identifying the next Amazon. This means that there will be far less participation in bubbles.
There is variability in the income of real estate, but it is easier to predict how much rent a building will generate in 10 years than it is to predict how much Google will earn in 10 years.
The lack of speculation is why REITs rose steadily through the early 2000s stock market collapse. In fact, from 2000 through 2002, REITs increased by 47% while the US stock market decline by over 40%.
Real estate is not immune to speculation and bubbles, but these events are rarer than they are for stocks. Stocks enter bubbles all of the time. Real estate bubbles are unique events. The 2006–2010 decline in real estate prices was the first significant decline in the value of real estate in 80 years.
Real estate is an “offense” component of my portfolio. It generates returns during periods of prosperity. When the economy suffers, real estate will suffer.
One of the worst declines for REITs was the global financial crisis from 2007–2009. During this period, this asset class experienced a decline of nearly 70%.
The nearly 70% decline makes it clear that real estate is economically sensitive. It is one of the “offensive” asset classes in my portfolio that needs balance with “defensive” asset classes, which I hold as long term treasuries and gold.
Additionally, while it is important to balance real estate investments with defensive asset classes, I also think it is essential to diversify with real estate investments globally, just as it is important with stock investments. The same case for diversifying internationally with the stock allocation applies to REIT’s. For this reason, I diversify my real estate investments globally. It is crucial to diversify away from a single country, just as it is crucial to diversify within the country’s geography.
Long Term Treasuries
Small-cap value, international small-cap stocks, and real estate are outstanding allocations when the economy is growing, but it will not protect from severe economic troubles, such as 1973–74, 2007–09, or 1929–32. All three of those asset classes experienced extreme losses during all of those events.
A prudent investor needs to be aware that there will be times when the economy will not be growing. History is replete with examples of economic problems.
Because the market behaves like an insane person, the market typically overreacts to these economic problems.
It’s easy to look at a long-term chart of an “offense” asset (one that generates returns during periods of prosperity), and see the declines as blips on a long-term trend upward.
From 1972 to 2020, the market grew wealth at a 10% rate. The market turned $10,000 into $931,000. Most people look at that long term track record and want to go all-in on an “offense” asset that generates high returns. Living through those intense drawdowns is another matter entirely.
The growth in wealth via the stock market does not happen in a straight line. Numerous market crashes happen frequently, in which stocks were sold off in horrific ways.
Here are some of them:
January 1973- September 1974: 46% decline
September 1987 — November 1987: 29% decline
September 2000 — September 2002: 44% decline
November 2007 — February 2009: 51% decline
Buy-and-hold purists would say that someone should hold through those declines and ignore the price action.
As someone who has lived through three market crashes, I can tell you that this is impossible. You are going to watch the market decline, and you are going to worry about it.
For this reason, I hold an asset in my portfolio that performs very well during market crashes. The asset that performs best during a market crash is long term treasuries. Whenever stocks do poorly, long term bonds tend to do well.
Long term treasuries are nearly always up during bad years for stocks.
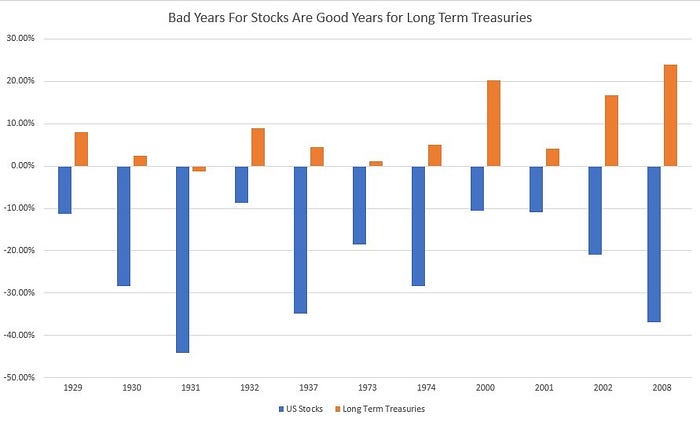
Long term treasuries are bonds issued by the federal government with extended maturities. The longest maturity that the federal government has is the 30-year treasury bond.
Treasury bonds perform well in market crashes for a few reasons:
Interest Rates — The Federal Reserve typically cuts interest rates during a market crash. The Fed cuts rates in an attempt to boost economic growth. Bonds benefit from lower interest rates.
It sounds counter-intuitive that lower interest rates would be good for bonds, but it’s true. Bonds go up when interest rates go down. The payment on a bond (called a coupon) is usually for a fixed dollar amount. For the interest rate to decline on the bond, the price of the bond itself needs to go down.
For instance, if I had a $1,000 bond that paid $100 per year, it would be a 10% interest rate. If the $100 payment doesn’t change, then the bond’s price needs to be adjusted if interest rates go down. If I wanted the bond to yield 8% on the $100 coupon payment, the bond would need to increase to $1,250.
Longer-term bonds are going to have the most extreme move in price when interest rates decline. As a result, they are going to have the most drastic change in price. When the Fed is cutting interest rates, long-term bonds will experience the most extreme move to the upside.
Flock to safety — When the world is melting down, investors worldwide want to hold safe assets. They don’t want to hold risky assets like stocks, which can go down a lot during a market crash. They want to keep something safe and secure.
For the last century, there has not been an asset that is more secure than a US treasury bond. The US government is unlikely to ever default on its obligations. The US government could always print money to pay treasury bonds, meaning that the risk of default is practically zero. The US government can also can tax the biggest economy on Earth. For this reason, it is unlikely that they will ever default. This is an attractive characteristic and makes them an appealing asset when the world is going to hell.
As investors pile into treasuries during a panic, the price of treasuries increases.
What is the actual performance of treasuries during stock market crashes?
September 1987 — November 1987: 6% increase
September 2000 — September 2002: 30% increase
November 2007 — February 2009: 15.5% increase
During the worst crash of all time from 1929 to 1932, long term treasuries delivered outstanding results.
1929 — Up 7.95%
1930 — Up 2.52%
1931 — Down -1.36%
1932 — Up 8.92%
These Depression-era results occurred during a period when stocks declined by 75%. An investor who balanced out their “offense” stock portfolio with a defensive asset like long term treasuries could have reduced their losses during this period.
Treasuries usually begin to increase before the crash. When the economy first shows signs of slowing down, the Fed typically begins cutting interest rates early. In 2007, long term treasuries went up 9%. In 2019, before the recession of 2020, they went up 14%.
Indeed, treasuries are an excellent asset to own in the event of a market meltdown. Additionally, unlike selling short (betting that stocks will go down) or buying insurance products (like hedging strategies), long-term treasuries should increase in the long run. Selling short and hedging often lead to long-term losses, even though they will go up during crashes. Treasuries won’t increase as much as the “offense” asset classes in a portfolio, but they will at least generate some interest income and pay back principal. That can’t be said for other “insurance” strategies.
I think of long-term treasuries as an insurance policy against market declines that pay interest over the long term. Unlike most insurance products, long term treasuries don’t lose money over the long run. In fact, they pay interest.
Imagine having car insurance that pays you interest every month instead of costing premiums. That’s essentially what long-term treasuries accomplish in a portfolio.
Of course, while long term treasuries have a track record of performing well during market declines, there are risks in owning them.
There are four potential risks to owning treasuries. The largest risks are inflation and higher interest rates. Persistently low interest rates are another outcome that can harm the long term returns of treasuries. Earlier, I mentioned that default is unlikely for long term treasuries. While it is unlikely, it’s not impossible.
Inflation — I mentioned earlier that the Federal Government could print money to make sure that treasuries don’t default. If they can’t pay their obligations, they can always print dollars to pay back treasury holders.
While printing money can eliminate default risk, printing money is not a free lunch and carries risks of its own.
Printing money can create inflation. If inflation increases, then the purchasing power of the bonds will decrease. If you’re paid back $100 on a bond and it doesn’t default, just because default didn’t happen does mean that the investor didn’t lose money. Inflation can cause losses.
If $100 could pay a grocery bill when you bought the bond and now it can’t buy two items off the value menu at McDonalds — it gives a bond investor little consolation that the bond didn’t default. The bond may not have defaulted, but the purchasing power of the interest and principal payment has significantly been reduced.
Interest rates — Bonds go up when interest rates go down. The inverse is also true. If interest rates increase, then the value of those bonds will go down.
If interest rates are increasing because the economy is doing well, then that can be good for a balanced portfolio. A balanced portfolio will own riskier assets like small cap value stocks and REITs that should do well in this environment, because earnings are likely increasing and the economy is in a boom. The “offense” assets in a portfolio ought to make up for any decrease in long term bond prices.
Unfortunately, prosperity isn’t the only reason that interest rates can go up. Sometimes, the Fed may be increasing interest rates to deal with inflation. This was the case in the late 1970s and early 1980s. Long term bonds went down by 20% during this period. Unfortunately, stocks weren’t doing well either.
It is also possible that interest rates could increase if the bond market is worried about the federal government’s ability to repay the bonds. If government deficits increased to unsustainable levels, this could theoretically happen even though it is unlikely.
Low Rates — As I write this, the 30-year Treasury bond yields only 1.3%. These are historically very low and guarantee low returns going forward. Rates could increase, but this would cause the treasury bond to decrease in price.
Interestingly, as rates go lower, the price movements become more pronounced. For instance, a move in rates from 1.5% to .5% will see a more significant increase than a move from 6% to 5%. This phenomenon is known as convexity. Convexity means that despite the low rates, treasuries will still offer protection when rates are declining during market downturns.
For this reason, long term treasuries are still appealing despite the guaranteed low future returns. They should continue to perform well during a market downturn. The low rates may even pronounce these benefits. They aren’t in the portfolio for a high return: they are in the portfolio as insurance against a market decline.
Default — It is unlikely that the Federal government defaults, but it isn’t outside the realm of possibility. The US government had a near-default event in 2011 when a showdown over the federal government between President Barack Obama and the Republicans in Congress threatened the government’s ability to issue debt. The confrontation went down to the wire, and the US government almost defaulted. It came even closer than the headlines suggested, as documented in Bob Woodward’s book, The Price of Politics.
The government had no solvency issues in 2011, but politics almost caused a default.
A default could theoretically happen again. It is unlikely but possible. Based on the dysfunction in American politics, it can happen again. We currently have two political parties that aren’t focused on improving the country. We have two political parties that are solely focused on ruining each other and dividing the American people. Why wouldn’t they allow the economy to collapse if they thought the other side would take on the blame? I think both the Democrats and the Republicans are capable of this.
We were lucky in 2011 because the politicians eventually blinked and avoided the crash. What if they didn’t?
Unfortunately, the reality of finance is that there isn’t an asset without any risks. As safe as long term treasuries are, they aren’t truly free of risk. The goal of my portfolio is to own assets that balance out these risks. Treasury bonds aren’t truly risk free, even though they are in my portfolio to contain losses during catastrophes based on their historical track record.
For this reason, we need an asset that counter-balances the risks of owning treasuries but also acts as a defense during severe drawdowns in “offense” assets like small value, international small caps, and real estate. The asset that fulfills this role is gold.
Gold

While long term treasuries perform well during recessions, they are not without risks.
The critical risks against long term treasuries are inflation and higher interest rates.
Inflation is a threat to all asset classes, but it is particularly threatening to US treasury bond investors. If inflation were to take hold in the United States, then the actual purchasing power of those bonds will decrease.
Inflation is a constant feature of economic life. The US federal reserve tries to target a 2% rate of inflation. This reality often angers those who hate central banks. After all, a 2% rate of inflation means that 1 dollar becomes worth 55 cents at the end of 30 years.
Many curse our government for allowing inflation to take hold. Reasonable people can debate the issue. I tend to think a little inflation isn’t a bad thing, but many violently disagree with me.
With that said, even if you hate the government for allowing inflation, it is a fact of economic life that you are probably not going change. If the government tells you outright that they want 2% inflation: it’s probably a good idea to believe them. They have the power to generate that inflation rate even though you don’t like it.
2% inflation means that the principal on a 30-year treasury bond is likely to decline in purchasing power. If inflation is more than 2%, then the results will be more severe.
High inflation is typically associated with high-interest rates, something else that hurts treasuries. In an attempt to contain inflation, the federal reserve is likely to raise interest rates to control it. For long term bonds, this adds insult to injury. Interest rates and bond prices are inversely related. When interest rates go up, bond prices go down.
This nightmare scenario is what happened to long term bonds in the 1970's. While long-term bonds performed well during the crash of 1973 and 1974 and offered protection, they delivered negative returns over the decade when accounted for inflation.
The bad times occurred during a lost decade for US stocks. As treasuries declined due to inflation and rising interest rates, US stocks suffered because valuations fell due to as a direct result of the higher interest rates.
Higher interest rates and inflation are a particular risk right now, in 2020. Inflation has been low for several decades. Interest rates are now at their lowest levels ever. Even a modest uptick in inflation and interest rates will be very bad for long term treasuries.
Is there an asset that can counterbalance this risk? Is there an asset that holds up during stock declines, but also performs well during periods of inflation?
This asset exists and it is a controversial one: gold.
Gold had its best performance during the last time high inflation and interest rates were a problem: the 1970's.
The 1970’s were a lousy period for most asset classes, but gold performed spectacularly.
Gold rose from $35 in 1969 to $589 in 1980. The gold bull market was due to several factors, such as Richard Nixon’s ending of the gold standard, which allowed gold prices to float more freely than they did in the past.
High inflation rates also drove the price action of gold.
Gold doesn’t only do well during periods of inflation. Gold prices tend to rise during periods of growing fear, as investors flock to “hard assets.” The flock to hard assets is what occurred during the Great Depression. As people gathered gold, the price rose, rising from $20.63 in 1929 to $26.33 in 1933, a 27% increase during a period when stocks were down 80%.
The early 1930’s gold bull market was problematic for the United States, because the dollar was convertible to gold, and the US central bank was unable to generate rising prices. Because the central bank couldn’t increase the money supply, we effectively had a restrictive monetary policy during a severe recession. Imagine how bad 2008 would be if the Fed restricted the money supply instead of increasing it. That’s what happened in the early 1930’s. A restrictive monetary policy turned what would have been a severe recession into the Great Depression.
To fight this restrictive monetary policy, FDR ended the convertibility of dollars to gold and initiated price controls around the price of gold. This is part of what led to the economic recovery in 1933.
In terms of the portfolio, gold should do well in both periods of extreme fear and high inflation, serving as a nice asset to balance against the risk of “offense” assets and long-term treasuries.
The fact that gold does well during periods of inflation and fear means that it is an excellent diversifier against both stocks and bonds.
A good way to demonstrate the diversification benefits of gold is to look at a portfolio that is split, 50/50, between stocks and gold. This portfolio would be split evenly between US stocks and gold and rebalanced annually, meaning that every year the investor would sell whichever asset went up and buy whatever asset went down to return to the 50/50 split between stocks and gold.
On its own, gold is an absolutely terrible investment. It has massive volatility. It also endures extremely long drawdowns. Gold entered a drawdown in 1980 and didn’t fully recover until 2007, for instance. Because it doesn’t generate any earnings or interest, it has little promise to ever outperform US stocks. Since 1972, gold has returned 7.8%, while stocks have returned 10.25%.
However, despite the under-performance of gold, it can work well in a portfolio with other assets. This is demonstrated by the 50/50 stocks & gold portfolio.
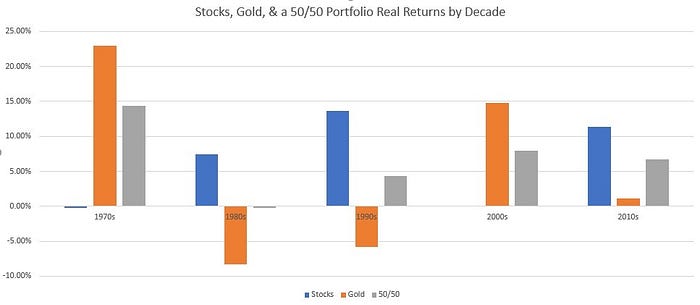
The interaction between stocks and gold in the 50/50 portfolio creates a result that is greater than the sum of the parts.
One would assume — for instance — that the return would simply be an average of the return for the two asset classes. Gold has a CAGR of 7.8% since 1972. Stocks have a CAGR of 10.25%. Averaged together — it is 9.025%.
However, in a portfolio, the actual result is 10.29%. It’s greater than the expected average of 9.025%. It’s greater than the return of either asset. The result is greater than the sum of the parts.
Why does this happen? It occurs because gold historically performs well when stocks are doing poorly. They are two asset classes that interact very well with each other.
Gold will do poorly during periods of declining inflation and prosperity, like the time from 1980 to 1999. The ’80s and ’90s were a period when gold fell from $589 to $290. The ’80s and ’90s were a period when stocks did very well. Meanwhile, gold did well when stocks did poorly in the 1970’s and 2000’s. It’s almost a perfectly uncorrelated asset to stocks. When gold and stocks are mixed together in a portfolio, they help balance against each other.
Gold is almost entirely uncorrelated to the stock market. This lack of correlation with stocks and bonds is why gold is such an excellent diversifier in a portfolio.
Gold will go down when stocks are doing well. Gold doesn’t go up significantly during an actual crash (long term bonds will do that), but it tends to remain stable.
Meanwhile, gold will do well when treasury bonds do poorly. Treasury bonds will go down in an inflationary environment of rising interest rates. Long term treasuries delivered an inflation adjusted return of -3.25% from 1970 to 1980. Gold, meanwhile, delivered an inflation adjusted return of 19.5%.
When gold is doing poorly in a portfolio, the stocks ought to pick up the slack and do well. Gold also balances the risks of long term treasuries by performing well in an inflationary environment like the 1970’s.
Gold also offers psychological satisfaction for risk-averse people like me.
I am comforted by the fact that gold has survived as a store of value throughout the history of human civilization. There have been many global empires throughout history: Egyptians, the Roman Empire, the British Empire, or the US. Through all of it, gold has retained value. Gold was valuable during the days of the Egyptian Empire and it’s valuable today.
Gold also serves as a store of value when nations collapse. Russian bonds went to zero during the 1917 Communist revolution. The Russian stock market represented a total loss. However, a Russian investor who owned gold still held something that was valuable.
When inflation ravaged 1920s Germany, their currency became worthless. German investors in traditional stocks and bonds were decimated. For a German investor who owned some gold, they weren’t wiped out. Gold retained its purchasing power. They may not have earned an extraordinary return. They experienced catastrophic losses in their stock and bond portfolios, but they at least preserved a segment of their net worth in gold.
It is currently hard to imagine the United States falling apart and a new global power emerging, but the probability is not zero. If the United States were to fall apart as the preeminent global power and the US dollar were worthless, gold would still be worth something.
My portfolio has 60% in “offense” assets that perform well during periods of prosperity. History tells us that prosperity is more likely than decline. With that said, I want protection. The gold that I own gives me comfort. If this long stretch of prosperity were to end, I own something which will still have value.
The added diversification of benefits and uncorrelated return to US stocks are a bonus.
Critics of gold will say that it isn’t going to earn as high a rate of return as my stocks. I agree.
The thing is: gold isn’t in my portfolio for a high rate of return. I own gold because of its diversification benefits and safety. It’s an insurance policy against things going catastrophically wrong.
I expect that gold will mostly keep track of inflation over the long run. I also expect that it will maintain an uncorrelated relationship with stocks and bonds. Gold will do well when stocks and bonds are doing poorly. Over the long term, gold will mainly keep pace with the inflation rate. This relationship isn’t guaranteed, but history suggests it will continue.
For these reasons, I include gold in my portfolio.
Performance
What happens when you put all of these assets into a portfolio? US small value, international small, real estate, long term treasuries, and gold. Equally weighted, 20% in each asset class, re-balanced every year. Do they interact with each other in a desirable way?
Do their unique characteristics achieve the desired result: Are drawdowns contained? Are bubbles avoided? Does it achieve a satisfactory rate of return?
I’ve explained my theories for how all of these asset classes should interact with each other. Do my opinions make any sense in the real world?
Does this weird portfolio work?
Does the portfolio produce a satisfactory rate of return? Does it reduce volatility and lessen painful drawdowns?
It’s time to look at the historical data to see if these asset classes work together well.
Each asset class is weighted by 20 % in the portfolio. We will then assume that we re-balance the asset classes annually. At the end of every year, we’ll sell what has gone up, and we’ll buy what has gone down, and get the portfolio back to the 20% equal weights.
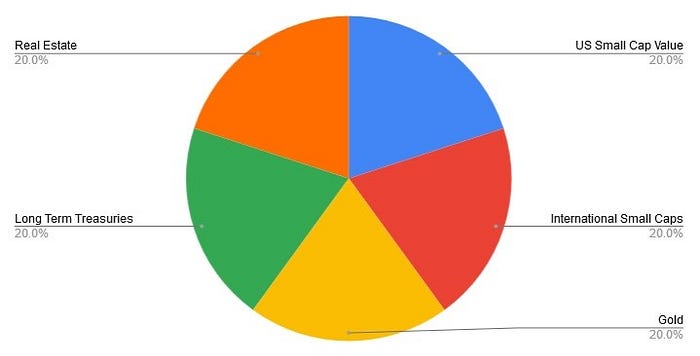
Since 1970, this portfolio has generated an average 7.7% rate of return after inflation. This is almost as high as the US stock market, which has delivered an average real return of 8%.
This result is accomplished with much less severe drawdowns and less volatility than the US stock market. The worst year for this portfolio was 2008, in which it lost 19%. That year, the stock market declined by 37%. Before 2008, the worst year for the portfolio was a loss of only 11%. The stock market declined by 30% during the 1987 stock market crash, almost 50% in 1973–74, and nearly 50% in the early 2000’s — declines which the weird portfolio barely participated in.
This performance also compares favorably to a 60% US stocks, 40% US bonds portfolio. Over the same period, the 60/40 portfolio would have returned an average of 6.1%.
It’s also worth noting that the 60/40 portfolio benefited tremendously from a 40-year bull market in bonds, which took interest rates from 20% to almost 0% from 1980 through 2020. That can’t happen again. The fact that interest rates won’t decline like that again means that 60/40’s performance is a feat that won’t happen again.
My portfolio performs well in flat markets like the 2000s, while the 60/40 portfolio does not. From 2000 through 2009, my portfolio returned 10.6%, while the 60/40 portfolio only returned 3%.
The weird portfolio achieves my goal of avoiding lost decades like the 1970’s and 2000's.
Additionally, the weird portfolio can deliver a consistent return in all economic environments, while the 60/40 portfolio has benefited from the unique environment of 40 years of declining interest rates.
The portfolio was quite resilient during the 1970s, which was a lousy time for stocks and bonds.
From 1970 through 1979, this portfolio returned 15.3% compared to 7.1% for 60/40. The differences are starker when you factor inflation into the returns. My portfolio returned 7.4% after inflation, while the 60/40 recorded an annual loss of .23%.
1973–74 was the worst bear market to occur after the Depression and before the financial crisis. How did the two approaches handle that debacle?
In 1973, my portfolio gained 4.2%, while 60/40 declined by 9.8%. In 1974, my portfolio gained 1.3%, and 60/40 lost 14.3%.
The weird portfolio reduced drawdowns during the last 50 years. How did it perform during the worst drawdown of all — the early 1930s?
Most of these asset classes did not exist during the Depression, but return data is available for small-cap value, gold, and long term treasuries.
Assuming that the portfolio owned 60% small value, 20% gold, and 20% long term treasuries, then it would have lost roughly half of its value from 1929 to 1932, compared to an 80% loss for a stock-only investor. It would have also fully recovered by 1935. By the end of the 1930s, this portfolio would have been up 20%. In contrast, a stock-only investor was still at a loss by the end of the 1930s.
The weird portfolio’s performance during horrible moments like the 1930s, 1973–74 crash, and 2008 is due to the fact that 40% is in defensive assets like gold and long term treasuries. The fact that the portfolio still delivers stock-like returns with such a large allocation to low-return defensive assets is extraordinary.
The fact that 40% of the weird portfolio is in defensive assets like gold and long-term treasuries helps the portfolio stay resilient and perform well through significant bear markets, like 1973–74, 2000–03, and 2007–09. All of these were periods where the stock market declined by nearly 50%. This portfolio made money in the 1973–74 drawdown and 2000–03 situations. In 2008, it lost only 18%, while the stock market was down 37%.
When stocks decline, the defensive assets usually deliver gains. This gives the investor dry powder to pile into “offense” assets when they have performed poorly.
The portfolio beats a US index fund by several other metrics, too.
Since 1970, the longest time the weird portfolio took to recover from a drawdown was three years. In contrast, the US stock market’s most prolonged period to recover from a drawdown is 13 years. The weird portfolio is resilient. Diversification helps avoid lost decades.
I think the best measurement of a portfolio is its perpetual withdrawal rate. The perpetual withdrawal rate is the amount of money that can be withdrawn from a portfolio every year and maintain the principal balance while accounting for inflation.
Due to its versatility, this portfolio has a high perpetual withdrawal rate of 5.4%. The US stock market has a perpetual withdrawal rate of 3.5%. This high perpetual withdrawal rate is due to the positive attributes of the portfolio — a high rate of return, shallow and short drawdowns, and consistent returns over the decades.
This result is achieved with less risk than the overall stock market. Instead of having all of its bets on one potential outcome (US prosperity), this is a diversified approach prepared for multiple economic outcomes.
This portfolio has elements that will perform well in all economic environments.
Gold and real estate should do well during periods of inflation. Long term treasuries will probably suffer in this environment.
Long term treasuries should perform well during periods of deflation and financial disaster, like 2008 or the early 1930s. The “offense” aspects of the portfolio will probably suffer drawdowns during these events.
Gold and long term treasuries should hold up well during bear markets, while the offensive segements of the portfolio will likely decline.
Small value, small international, and REITs should perform well during prosperity. Long term treasuries and gold will likely do poorly.
Small international and gold should perform well during periods of dollar weakness. The US segments of the portfolio will likely suffer in this environment.
Small US value and REITs should perform well during periods of dollar strength, while the international investments and gold will suffer.
Meanwhile, the portfolio protects from political upheaval in the United States. If the US were to turn its back on the economic policies that made the country great, the portfolio has assets held in other countries. Losses will likely occur, bu they won’t be fatal.
In the worst-case scenario — a total global economic collapse — the portfolio owns gold, which has retained its value throughout human civilization. Gold will at least retain 20% of a investor’s wealth during that kind of horror show. A total impairment of capital will be avoided.
Indeed, the portfolio not only reduces risk on a spreadsheet, but it also reduces risk from a practical and logical perspective.
Meanwhile, if history is any guide, it should produce a consistent and satisfactory return over the inflation rate.
This portfolio is also available to average investors like me. Every asset class in this portfolio can be purchased cheaply by anyone with a brokerage account. You don’t need the ability to access private information.
The portfolio doesn’t use exclusive assets that are only available to rich people like hedge funds, private equity, or venture capital.
An investor in this portfolio doesn’t have to be a genius in evaluating businesses.
All of these asset classes are available to everyone and can be accessed cheaply without paying a lot in fees.
In short, this a portfolio that helps me sleep at night while still growing over time. I don’t have to worry about the future or predict what’s going to happen.
At the same time, I can look to the future with confidence that elements of my portfolio will do well no matter what history throws at it. Meanwhile, I can have the confidence that if human civilization continues to advance and grow, then my wealth should grow with it.
Implementation
I believe I have a group of asset classes that will deliver a consistent rate of return over the very long run. I have confidence that the asset classes in this portfolio will balance each other and provide a satisfactory performance over the long term. It should protect against depressions, recessions, inflation, and deflation. It diversifies globally to protect against a political disruption within the United States.
I have back tested and battle tested this portfolio through a variety of historical events and know it achieves the desired result. Drawdowns are reduced, bubbles are avoided, and a satisfactory rate of return is achieved.
Most importantly, the portfolio doesn’t require that I pick winning stocks or accurately predict economic events. It is diversified among a broad range of outcomes and is ready for most of what I can imagine the world will throw at it.
Now, how do I invest in this portfolio from a practical perspective? What are the actual nuts and bolts actions I need to invest in this approach?
There are two main ways for the average investor to access broad-based diversified asset classes: passive and actively managed funds.
Both vehicles allow for an investor to place a small amount of money in a larger pool of assets.
My preference is towards passively managed funds.
What is a passively managed fund?
In the case of a small-cap value fund, a “passive” fund will buy the entire US small-cap value universe. It will rank stocks by various metrics — such as price to book or price to earnings — and purchase the cheapest segments of the market. It won’t predict which cheap stocks will outperform; it will merely provide access to that asset class.
An actively managed fund will attempt actually to pick which stocks are going to outperform.
I don’t want an active management style because I don’t believe that most active managers can genuinely choose the diamonds in the rough that will beat the universe of small-cap value stocks. In other words, no one is picking stocks or bonds within the fund. They are delivering the exact return of the asset class.
Many people stylize themselves “value investors.” I’m one of them. While all value investors hope to be the next Warren Buffett, the truth is that few people can predict which value stocks are going to outperform. While value stocks as a group outperform the market, active value investors often under-perform the market. The under-performance is because value investors eliminate the “duds” from the universe, but sometimes the duds provide the best returns. They often systematically avoid the best performers in their effort to reduce value traps.
This under-performance of active managers isn’t only a small-cap value phenomenon. Active managers under-perform for nearly every asset class. International investors struggle to identify global stocks that will outperform. Bond investors struggle to find which corporations are most likely to pay off their bonds. Growth stock investors often miss the winners, too. It doesn’t matter. Human beings tend to detract from results, no matter the asset class or strategy.
Another reason I don’t want actively managed funds is that they tend to charge higher fees than passively managed funds. Active funds have to pay people to analyze company filings. They have to talk to management. They will have meetings in fancy conference rooms. All of this action costs money, which trickle down to investors in the form of fees. Fees eat into performance, and anything I can do to minimize those fees is terrific.
To reduce fees and maximize returns, I invest in passively managed funds.
The next question is: what fund vehicle should I choose? There are two main options for retail investors like me: ETFs and mutual funds.
How do I decide what is appropriate for me: ETF’s or mutual funds?
Mutual funds are the traditional investment product for retail investors. They have been around for decades. You send the fund your money; they invest in the assets. Because you are investing in a large group, you are getting a high level of diversification.
Similarly, when the investor withdrawals money, the fund needs to sell assets to give the client their cash. They typically do this for the value at the end of the day. The fund’s value is called “net asset value,” or NAV. When the mutual fund investor withdrawals their money, they receive their payment at the NAV value.
In the 1990s, an alternative to mutual funds emerged: exchange-traded funds, or ETFs.
I invest mainly in ETF’s. I do this because ETF’s have some critical advantages over mutual funds.
With a mutual fund, the investment company is investing the investor’s money directly. With an ETF, the fund trades in an open market on an exchange. The ETF will raise cash in the market by selling shares, and the ETF then takes the proceeds of that share issuance will be used to buy the assets. When a new investor wants to invest in the fund, they have to purchase the shares from someone else.
This unique structure creates some very critical advantages over traditional mutual funds.
First, it reduces fees.
Money isn’t constantly pouring in that needs to be invested. The ETF doesn’t necessarily need to sell positions when investors redeem cash. When an investor needs to liquidate their holdings, they can sell their shares to another investor. Therefore, the ETF doesn’t have to go through the hassle of selling assets to meet redemptions.
The ETF also doesn’t have to send individual statements to every investor in the fund, detailing their position.
Because the operational costs are lower, ETFs tend to have lower expense ratios than traditional mutual funds.
Second, ETF’s have less of a tax burden than mutual funds.
An ETF investor only needs to pay taxes when they receive dividends from the fund or sell their shares for a profit. In contrast, a mutual fund is continuously buying and selling stocks, which has taxable implications that travel down to investors in the mutual fund.
Perversely, a mutual fund investor can pay taxes on gains they weren’t even around to experience. For example, if an investor buys a mutual fund at the peak of a stock market bubble, they can pay taxes on gains they did not experience. The mutual fund will have to pay taxes on the bubble-era gains, which they pass on to investors in the fund. A brand-new investor might invest in a fund at this moment. The investor wouldn’t have been around for those gains, but they now need to pay the taxes on those gains. In a mutual fund, taxes are passed onto investors, regardless of whether they were around for the good times.
None of this happens in an ETF.
The disadvantage of ETFs is that investors aren’t guaranteed to receive the net asset value when they sell. Investors can only obtain what other investors are willing to pay for their shares in the ETF when they attempt to sell.
An ETF investor fears that there is a significant difference between the NAV and what they will receive when they sell their shares.
This rarely happens, even though it is not impossible.
Substantial differences from NAV rarely happen because traders all over the world actively trade ETF’s. They will sell ETF’s when they drift above their NAV and buy when they are below it. These actions keep the ETF’s share price close to the NAV.
Another tool that ETF’s have to keep the price around the NAV is called creation/redemption. The ETF has agreements in place with entities known as authorized participants to exchange baskets of the ETF’s assets in exchange for shares. Authorized participants can also sell the ETF baskets of assets. The ETF can create new shares when the price is above NAV and destroy shares when the price is too low below NAV. Creation/redemption helps keep share prices in line with NAV.
Dislocations from the ETF price and the NAV are possible, but they’re rare, and there are mechanisms to prevent it from happening.
I think that the lowers fees of ETFs, and their tax advantages overwhelm the potential disadvantages — i.e., differences between the ETF price and NAV.
For these reasons, I own ETF’s instead of mutual funds.
I also predominately buy ETF’s from one company, Vanguard. I choose to invest in Vanguard ETFs because I trust the integrity of the company. Their ETF’s are also heavily traded, which reduces the likelihood that they will diverge from NAV. Vanguard also tends to have the lowest fees.
I invest in the below ETF’s:
VSS (Vanguard International Small Caps)
VBR (Vanguard US Small Cap Value)
VNQ (Vanguard US Real Estate)
VNQI (Vanguard International Real Estate)
VGLT (Vanguard Long Term Treasuries)
However, there is one asset class for which Vanguard does not offer an ETF. That asset class is gold.
There are multiple gold ETF’s, but the one I choose to invest in is the Aberdeen Standard Physical Gold ETF (SGOL). This fund has a low expense ratio of .17%.
SGOL holds gold in vaults in Switzerland and the United Kingdom. As a result, the ETF shares equate to exposure in the actual physical gold held in those vaults.
As a result, SGOL closely mirrors the changes in the actual gold price for a low fee.
Some investors may not be comfortable owning gold via an ETF; they may want to store physical gold bullion in a safe or in a safe deposit box at a bank. Physical storage isn’t my preference for gold exposure, but it’s a perfectly valid way to do it.
Investing in these ETFs is simple. These ETFs are available through any brokerage account. I simply calculate the percentage of exposure I want in each asset class and then invest that amount in each ETF.
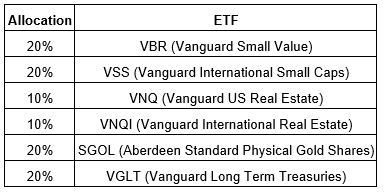
These ETF’s will fluctuate. For that reason, every year, I rebalance. I rebalance once a year for tax reasons. If the capital gain occurs after one year of investment, then taxes are paid at a lower rate. Taxes are higher on gains realized before one year. If the holding period is over a year, then the tax rate is capped at 15%. If held for less than a year, then it will be taxed at the personal income tax rate.
To meet the desired allocations in a portfolio, my ETF’s are held in the following weights:

If the investments are in a non-taxable account like an IRA, this wouldn’t be a concern, but regularly rebalancing is critical for reasons that have nothing to do with taxes.
Why does regular rebalancing increase the rate of return? The answer is simple: it forces an investor to buy low and sell high.
During a rebalance, the investor sells the assets that have done well and buys the asset class that did poorly.
For instance, in a time like 2008, the investor is selling winning treasury and gold positions and then buying stocks. During a moment like 2000, the investor is selling stocks and buying defensive assets like gold and treasuries. Every year, the investor is making a contrarian bet. This regular rebalancing is what generates the returns over time.
Additionally, without this rebalancing, certain asset classes would eventually overwhelm the portfolio and bring the asset classes out of balance. The “offensive” assets would dominate the portfolio, increasing volatility and the severity of drawdowns.
With that said, re-balancing may not be necessary when regularly saving money. If a large amount of money is saved in a year, then an investor can simply purchase more of the asset that is a lower percentage of the overall account. The new buys can bring the portfolio back into balance.
Managing the account is easy to do. An investor simply needs to calculate the target percentages of each ETF, buy, and sell accordingly. It shouldn’t take more than 15 minutes of work every year, and it is easy to implement if done annually. A busy investor can leave their weird portfolio and only meddle once a year to bring it back into balance.
As I’ve stated throughout this book, my approach isn’t for everyone. Some investors would prefer owning mutual funds if they are worried about large divergences from NAV. Other investors might also want to own a different suite of ETF’s instead of Vanguard. That’s all perfectly fine.
This is the approach that I use for my own money. It makes a lot of sense, is very balanced, and should accomplish my financial goals.
It might not be for everyone, and that’s okay.
Alternative Approaches
My approach to asset allocation isn’t the only approach. It is simply the approach that works for me. I think it provides an appropriate risk/return and should provide me with satisfactory performance over the long run. I believe that I will avoid lost decades, bubbles, and significant drawdowns.
I think that the weird portfolio is well diversified in a way that will protect me from different economic environments while still providing a satisfactory rate of return.
However, not everyone is necessarily comfortable with my approach. That’s okay. This is indeed a very weird portfolio and unlike how most people invest. There are no market cap weighted index funds. It is overweight in odd segments of the market, like small cap value and REITs. It has a massive allocation to gold.
The asset classes are controversial. Small-cap value is controversial. Many believe that small-cap value will no longer outperform the market in the future. Critics cite several reasons for why it won’t beat the market, but a key argument is that they think this segment of the market is more scrutinized than before. Mechanically buying the cheapest small stocks may not offer the opportunity for out-performance in the future that it did in the past.
Some investors may not see the point of owning long term treasuries. The 30-year bond currently yields a measly 1.65%. Long term treasuries are not going to do as well as it did in the past.
Gold is also controversial. Gold is an asset that doesn’t provide any interest and is based entirely on what people are willing to pay for the commodity. Warren Buffett says that gold has no intrinsic value.
My portfolio also has a significant allocation to international stocks. Historically, US stocks have outperformed global stocks, so many investors would say: why own anything outside of the US at all?
I also have no allocation to market-cap-weighted indexes, which many see as the only sensible way to invest. After all, there is a lot of smart money trying to figure out what stocks are worth. Why should an investor fight that?
This is also a portfolio that is guaranteed to under-perform during massive bull markets like the late 2010’s and 1990’s. This wouldn’t be a suitable portfolio for someone who experiences a lot of FOMO — fear of missing out. They’ll talk to friends who are getting rich from the bull market, while the weird portfolio will deliver a lower return. The weird portfolio avoids bubbles by not participating in them. Some people may feel a need to participate simply because they don’t want to be left out.
Another criticism would be that I’ve based my portfolio on historical relationships that might not hold in the future. Long term treasuries go up significantly during recessions as interest rates decline. Gold does well during Depressions or rough periods of inflation. Small value performs well when the economy is doing well, such as in the early years when we emerge from a recession. International stocks are often cheap when US stocks are expensive.
I’ve based my entire approach to these un-correlated relationships. There is no guarantee that they will persist, even though I think that they are rooted in logical relationships that ought to continue into the future. I’ve explained my logic for why I expect these relationships to continue, but you may remain unconvinced.
There are many reasonable criticisms of my portfolio.
I’ve built a portfolio based on what makes sense to me. My beliefs, my risk tolerance, and my desire to not participate in bubbles. You might not agree and you may have different preferences as an investor.
You might not agree with my approach to investing, and that’s okay. My plan is not for everyone.
With that said, I hope that my approach has given you something to think about when looking at different investment approaches. I hope that it has given you a framework for how some key asset classes interact with each other and can make investing a less stressful and volatile process.
Asset allocation is a great concept and can help a person achieve their aims over time. As with all things, you have to decide what works for you.
If you don’t like my investment approach, there are plenty of other unique strategies that might work for you.
Here are a few that you might want to investigate and learn more about:
1. The classic 60/40 portfolio.
If you’re going to keep it basic, this is the approach. 60% US Stocks, 40% US bonds. Over time, this generated a 5.8% average rate of return after inflation with a 34% max drawdown. Twelve years is the most extended period that the portfolio remained in the red. It’s a decent approach.
Everyone hates on basic things, but let’s face it: like chocolate cake, Starbucks, the Beatles, or pepperoni pizza — something becomes basic because there is something inherently awesome about it. You can also implement this in a single Vanguard mutual fund, set it up to reinvest dividends and interest, and forget about it. They can do the rebalancing for you, and you don’t even have to look at it.
Vanguard has a variety of Lifestrategy balanced funds for a low fee that adopts this approach. Each fund has a mix of stocks and bonds. The 60/40 fund is the Lifestrategy moderate growth fund.
Ironically, many financial advisors put people in a 60/40 allocation and charge 1% for this allocation. Vanguard will do it for you for .13%.
There are drawbacks to this approach. As I discussed before, I think market-cap-weighted US equities are currently very expensive, which reduces future returns. Interest rates are presently meager, and bonds are unlikely to deliver the performance that they did over the last 40 years.
Of course, there are no guarantees that any other approach, including my own, will do any better than 60/40, so it’s an approach that might work for you.
2. The All Seasons Portfolio.
The All Seasons Portfolio is the portfolio created by Ray Dalio and promoted by Tony Robbins in his book, Money: Master the Game. This has achieved a 5.3% average rate of return, 16% maximum drawdown, and the longest that it was in the red was 10 years. The portfolio is 30% US stocks, 40% long term bonds, 15% intermediate bonds, 7.5% commodities, and 7.5% gold.
This portfolio is for people who watched 2008 and said to themselves: never again. This approach appeals to the risk-averse who never want to endure another episode like 2008 but still want to invest and grow their savings. Nearly 70% of this portfolio is in defensive assets for the sole purpose of reducing drawdowns.
There are a lot of assumptions built into this approach. I think that much of the return for the portfolio since 1981 is a vast, multi-decade reduction in interest rates. The decline in interest rates buoyed the profits in long-term bonds, which have delivered equity-like returns over the last 40 years with low volatility.
Interest rates won’t decline indefinitely. Interest rates typically rise during inflationary periods like the 1960s and 1970s. When inflation comes back, a fundamental assumption of the All-Weather allocation is that the gold and commodities will deliver a high return rate when the long-term bond allocation takes a beating. This is also an assumption of the weird portfolio, but there is no guarantee that historical relationship will hold.
3. The Bogleheads Three-Fund Portfolio.
The three-fund portfolio is the approach embraced by Bogleheads with three simple index funds. It’s 40% US stocks, 20% international stocks, and 40% bonds. It delivers a 5.7% rate of return, with a 32% max drawdown, and a 10-year money-losing period. It’s a sensible approach. You’re zeroing in on the three major asset classes and getting the market return on all of them for a low fee.
4. 100% US Stocks.
Straightforward and simple, but not easy. 100% investment in US Stocks is the approach embraced by the FIRE (financial independence, retire early) community. This approach is close to Warren Buffet’s recommended asset allocation (90% stocks, 10% bonds).
This approach will likely work in the long run, but it’s not easy emotionally. I don’t think all of the people who embrace this approach are fully conscious of the risks embedded in it. Since 1970, US stocks have earned a 7.6% real rate of return (hooray!) but had a 49% max drawdown (ouch), and 13 years of money-losing (double ouch). The max drawdown is from 2008.
The 13 year stretch of real losses begins in the 1970s, a decade of fantastic rock (Pink Floyd, Zeppelin) and terrible investment returns, which set the stage for two decades of supercharged performances in the 1980s and 1990s. Two decades of interest rates falling from 20% to 5% do amazing things for financial assets.
As I’ve mentioned before, US stocks are currently (as of early 2020) costly. The high valuations of US stocks suggest they will provide poor future returns. I think that valuation will eventually hurt US stocks, but I may be wrong.
5. The Permanent Portfolio.
Harry Browne, a libertarian activist, and best selling author, created the portfolio. It invests in four asset classes split equally: US stocks, gold, cash, and long term treasuries. It’s one of the most risk averse portfolios ever created.
Gold protects during inflationary periods or currency debasement. Cash restrains drawdowns and provides dry powder for rebalancing, along with providing a source of funds for shocks to income. Long term treasuries perform best in deflationary panics, like 2008 or 1929. The US stock market delivers a return during periods of prosperity.
And that’s it! Four asset classes and a minimal allocation to stocks.
For my portfolio, I used elements from Browne’s approach. Browne’s portfolio demonstrated to me the usefulness of long-term treasuries and gold, for instance.
Of course, my allocations are different. I don’t like market-cap-weighted US stocks because I think they are expensive and continuously shift between bubbles. I don’t want to have too much cash outside of my emergency fund, because I believe it is a drag on returns. I also want to be internationally diversified to diversify political risk.
The large allocations to long term treasuries and cash are also a significant drag on returns, especially at current interest rates.
As you can see, there are plenty of different asset allocation approaches, and mine isn’t the one true faith. Investing is a personal process that ought to be tailored to your own goals and tolerance for risk.
You have to do you. The weird portfolio might work for you. There might also be a different approach that works for you. It all boils down to who you are. What is your risk tolerance? What are your beliefs? What are your goals? Everyone is different and there isn’t one portfolio that solves everything.
With that said, I’ve spent a lot of time developing the weird portfolio as a vehicle for my savings. I have written this book in the hope that it might help someone looking for what I was looking for: a simple way to invest savings without paying an arm and a leg in fees. A portfolio that protects from multiple economic outcomes. A portfolio that avoids bubbles, lost decades. A portfolio with lower drawdowns and volatility while still offering an adequate rate of return.
I hope you found this approach and my explanation of it useful, even though it might not be for you. I wish you and your loved ones the best of luck in investing & life.
Back-testing the Portfolio: Data Visualization
Below is a back test and visualization of how this portfolio has performed since the 1970’s.
These charts are courtesy of the excellent blog at Portfolio Charts. The author of this website was gracious enough to allow me to use the return data from this site to conduct the back-tests.
I think this gives a good sense of how this portfolio performs in different economic environments while reducing volatility and drawdowns creating a consistent rate of return.
Keep in mind that all return information is inflation adjusted.
Average Returns
This portfolio has generated a 7.7% average rate of return since 1970. This almost matches the return of the US stock market, but the weird portfolio delivers this return in a far safer and more consistent fashion. It is also a higher rate of return than most available asset allocations.
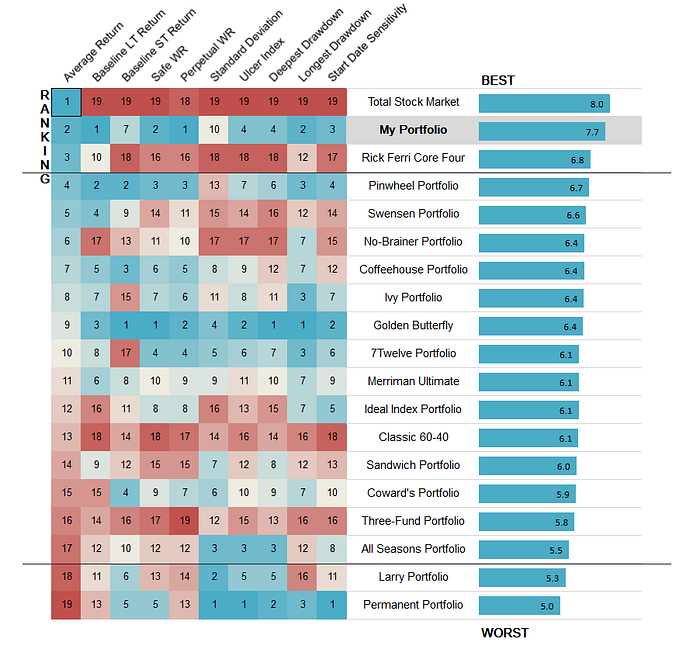
Severity & Length of Drawdowns
The worst drawdown for this portfolio was 19%. The longest drawdown for this portfolio was a little over 3 years.
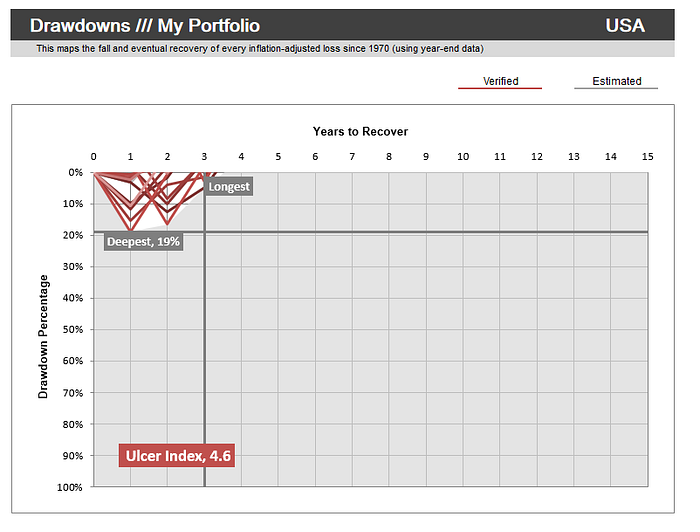
This compares favorably to both the 60/40 portfolio and owning the total stock market.
The traditional 60/40 portfolio suffered a 34% maximum drawdown that lasted for over 12 years.
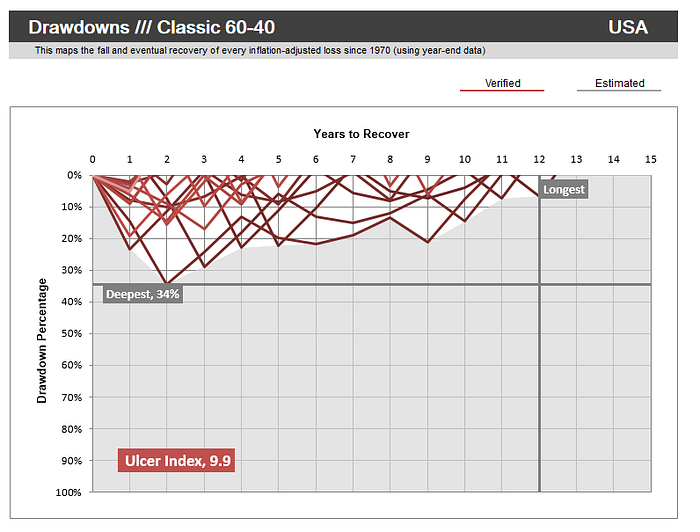
100% US stocks suffered a 49% maximum drawdown that lasted over 13 years.
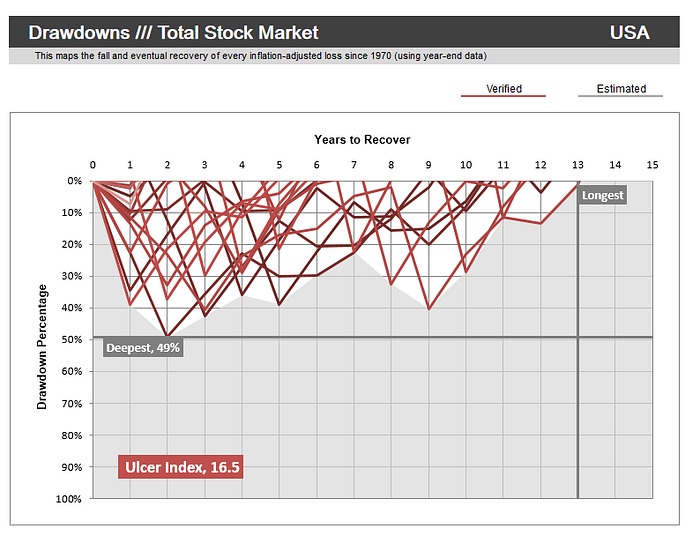
Annual Returns
Below is the annual performance of the portfolio from different start dates. As you can see, drawdowns do not last long and the portfolio usually rebounds to its long term rate of return of around 7% after inflation relatively quickly.
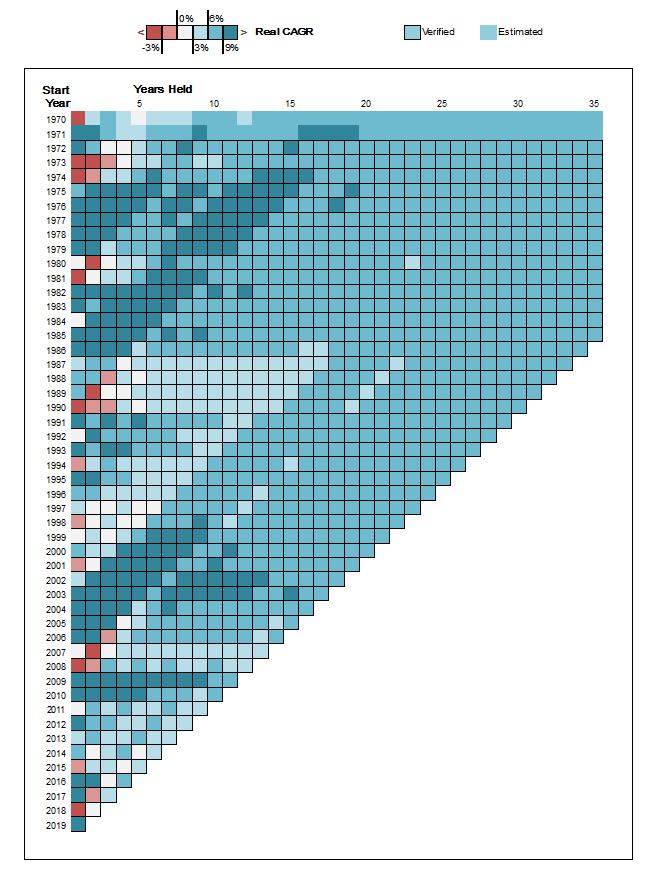
This holds up much better in contrast to the sea of pain in owning 100% US stocks.
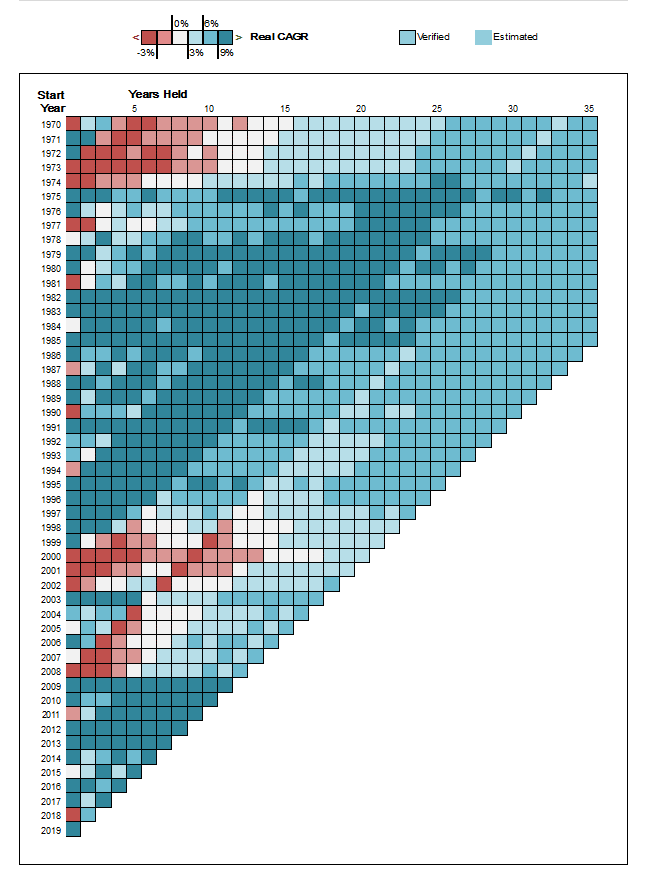
The 60/40 portfolio is also surprisingly painful in the 1970's, even though it has worked well since 1980. During the 1970’s, inflation and rising interest rates ravaged stocks & bonds. The excellent performance since 1980 is a result of a 40 year decline in interest rates. This is not something that can occur from present interest rates.

Perpetual Withdrawal Rate
The perpetual withdrawal rate is the amount that can be withdrawn from the portfolio every year without shrinking the principal balance when adjusted for inflation.
I think this is the most important metric for a portfolio. This simple metric is a clear expression of both the raw returns of a portfolio weighted against the consistency of returns and severity of drawdowns.
By this metric, the weird portfolio outperforms all other passive asset allocations.
The perpetual withdrawal rate for this portfolio is 5.4%.
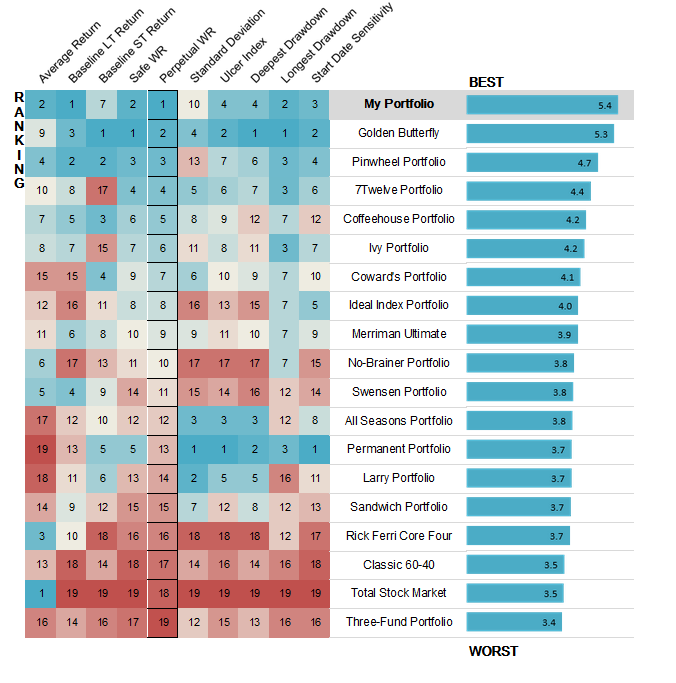
Stress
This portfolio also delivers its return with a low amount of stress, as measured by the Ulcer index. Unlike standard deviation, which measures volatility up and down, the Ulcer index focuses on downside volatility. In other words, an investor in this portfolio can invest in their portfolio without chugging Pepto Bismol during a stock market crash.
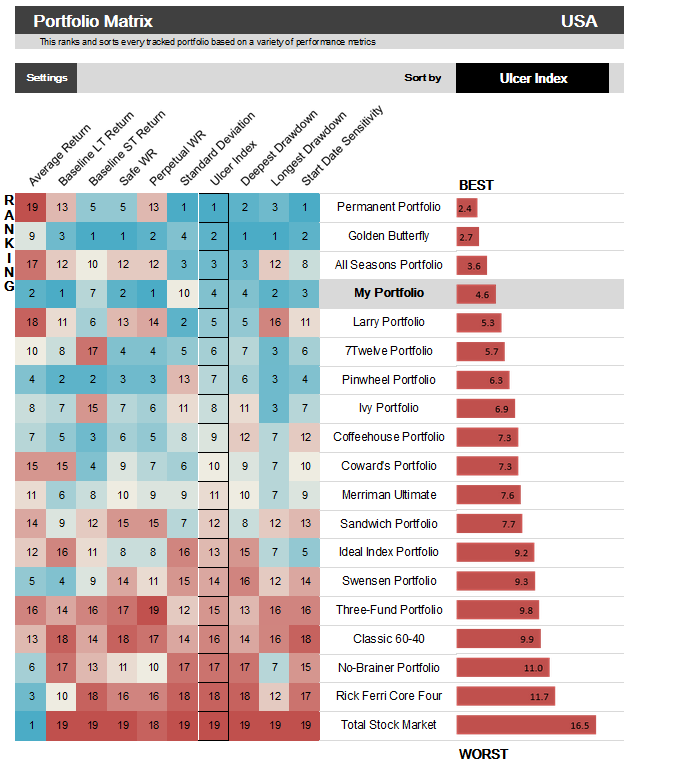
Disclaimer
The information on in this book is for information and discussion purposes only.
It describes the author’s approach to investing, which may not be suitable for all investors.
This book does not constitute a recommendation to purchase or sell any financial instruments or other products. Investment decisions should not be made with this book and it does not take into account the investment objectives or financial situation of any particular person or institution.
Investors should choose financial products based on their own risk tolerance and objectives. Investors should obtain advice based on their own individual circumstances from their own tax, financial, legal and other advisers about the risks and merits of any transaction before making an investment decision, and only make such decisions on the basis of the investor’s own objectives, experience, and resources.
The information contained in this book is based on generally available information and, although obtained from sources believed to be reliable, its accuracy and completeness cannot be assured, and such information may be incomplete, condensed, and may contain errors.
Investments in financial instruments or other products carry significant risk, including the possible total loss of the principal amount invested. This book does not purport to identify all the risks or material considerations which may be associated with entering into any transaction. The author of this book accepts no liability for any loss (whether direct, indirect or consequential) that may arise from any use of the information contained in or derived from this book.